Sunday, April 28, 2013

Update for the week of April 22nd to April 26th, 2013

Welcome back to CRI's ongoing Crude Oil Day Trading Blog. 

After taking a month off from writing this blog I thought it was about time to update it.

Price analysis you see (first chart & commentary) is CLM3, for the week of April 22nd to April 26th, 2013. Each trading day (time permitting) a 15 minute chart is added and trades for that day are analyzed:
Market Overview: 04/26/13: As the US Dollar continues to resolve around the important 83-84 level few new commodity market trends have been established over the past week's trade. As the month of May approaches we can clearly see the market shifting out of a 'fall/winter' stance and into a 'spring/summer' one. Equity markets have had substantial seasonal rallies, commodities and commodity currencies are failing and interest rates appear to be bottoming. These are all hallmarks of a typical seasonal peak and this is exactly the time of year it is supposed to happen. So ironically enough, while some price action may seem a bit chaotic at the present, things are actually quite normal...

Weekly highlight: The long consolidation between $89 and $98 resolved itself bearishly two weeks ago and the market spent the past week trying to recapture that range. On the heals of a relatively benign inventory report, potential escalation of Western involvement within Syria and numerous terrorist threats (some real and some not so) price raced back up to the 50% level of the sell off and then consolidated into the weekend. Given the seasonal nature of the energy market and the Commercial's current net bearish stance,  I am looking for the market to run into some serious resistance above $94.00. Having said that, once on the other side of this seasonal window (mid June) I shall be looking for the Large Institutions to get paid as they have remained net long (currently at about a 4:1 basis) for some time now as price has either gone sideways or higher over the past couple quarters. Not surprisingly, it would seem $100.00/barrel is our collective 'line in the sand' for the resumption of the previous bull market.

Trading Strategy (1 week):
Initially, I will be looking for a test of Friday's highs. Should those highs be taken out then I shall look for an ultimate move up to fill the gap at the top of the recent Daily trading range. If Thursday's highs prove too much of a barrier, I shall be looking for a test of the 50% level (on the 2 hour chart) and then an ultimate move down into the OTE Long Sweet Spot. A move down into that area ought to represent an interesting long trade location.
 
Revised trading plan with short term filter: 
I have spent the past month studying the 5m chart in detail. I have found that trend line breaks at VolProfile pivots are good entries. So in conjunction with both my Time Frame setups (5AM, 6AM, 7AM & 8:30AM pst) I will use my BoT signals (15m & 1hr chart agreement on trend) to generate directional signals. I will then refer to the 5m chart to take positions. This means I may not take each time frame setup and must remain vigilant throughout the entire trading day as these trend line breaks can happen at any time.
 
Mental State Review:
I have been taking it very slowly of late in my Crude Oil day trading (I havn't even posted a note to this blog in over a month). I have created an 'algo' that identifies option positions where the market pays you to take a position. It has been very hard for me to stomach the kind of risk one has to take trading futures in the face of almost no risk option trades. It has been interesting to see how my internal reaction has been to distance myself from 'risky' futures trading as I watch this new algo go to work. Anything one does in the market should be 'fun'. If it isn't then work becomes very unattractive on a daily basis. I have found the margin of error in trading Crude Oil Futures contracts is so small that many days it just isn't fun and almost seems like a perpetual trap...

That's all for this post, 

Brian Beamish FCSI
The Canadian Rational Investor
the_rational_investor@yahoo.com
http://www.therationalinvestor.ca
http://crisdaytrading.blogspot.ca/

Sunday, March 24, 2013

Update for the week of March 15th to March 22nd, 2013

Welcome back to CRI's ongoing Crude Oil Day Trading Blog. Price analysis you see (first chart & commentary) is CLk13, for the week of March 15th to March 22nd, 2013. Each trading day (time permitting) a 15 minute chart is added and trades for that day are analyzed:

Market Overview:
03/22/13: The US dollar index this past week showed signs of fatigue any time it pointed its nose above 83.00. As previously mentioned, 83-84 represents a significant battle zone for the index and its ultimate resolution ought to give investors a guide as to 'fear' vs. 'greed' expectations for the coming weeks and months ahead. Given this is Japanese fiscal year end, we may see trend resumption once on the other side of that event. Interestingly too, that event will mark the beginning of Q2'13 and we shall be given yet another brief glimpse at what fund managers are doing with their new capital. Elsewhere, the professor of economics (HG Copper) had something to say this past week. While still contained within a larger channel, Copper prices registered a weekly double top breakdown suggesting lower, not higher prices ahead. With that in mind I thought we ought to take a look at what is going on there in this week\'s WCTS Blog.

Weekly highlight:
The ill-liquidity of the Japanese fiscal year end has played heavily within the energy space. Volumes have dried up and volatility index's are at or near historic lows. Energy prices in general and energy stocks in particular started the week off on a poor note but attempted to reverse higher heading into the weekend. Indeed, USO itself registered a rare "DI' buy signal (where both the short term and medium term DI trending signals occur at the same time). Given this reversal type action and the fact that the '1st 2 weeks' study of Q1'13 suggested energy and commodities in general would do ok through the quarter, I am actually expecting a bit of a rally over the coming week. Considering May Crude oil's significant gap at 95.65, I shall be looking for that level to be traded to over the coming sessions. Considering too the general overt bullishness of institutional holding at the present, I wouldn't be surprised to see a burst higher through the first two weeks of Q2'13...

Trading Strategy (1 week):
BoT (Break out Trades) I am very comfortable working with my 15m charts and playing double bottoms & tops for moves to either 50% levels or OTE sweet spots. Ideally BoT entries come at or near hourly/4 hour OTE ss levels. The key with BoT's of late seems to be to only enter a position on a touch of the 13ema following the double top/bottom. Most trades take less than 10 ticks of heat and easily move +30 ticks in the trend's favor. So with this in mind, my trading strategy is to concentrate on BoT entries at or near hourly/4hr OTE levels. If this initial trade entry does not work and I still have confidence in the 15 minute price pattern, I will take my 2nd attempt at the trade at the OTE ss (level with stops 4 ticks below previous significant low). The end reult of this second attempt will mark the end of my trading day regardless. I will finish the day either +$140 (+30 stop hit), +$250 (AOCO +41 hit) or $-310 (personal loss limit hit). I want to focus on 5:30AM to 8:30AM trading window and take every setup that occurs during this window of time.
Revised trading plan with short term filter: As per my revised trading plan (trading plan April, 2013) I now shall consult the 3 minute chart before 'pulling the trigger'. If the 3 minute chart has yet to turn then I shall wait before blindly buying/selling at either Setup 1 ('edge') or Setup 2 (OTE SS). This may mean being a bit more patient in getting in but I like the idea of the 3 minute chart confirming short term momentum and volume are with the trade setup. I was finding just blindly buying at a certain level left me with a lot of anxiety and using this latest filtering method on Friday both filled me with confidence and relieved that anxiety.  
Mental State Review:
While I believe I am ready to take the next step my trading of the past week does not confirm this. I need to be more focused on executing in the setup zones and not making excuses to not perform. The plan is good and I know it works - trade the plan...  
That's all for this post, 

Brian Beamish FCSI
The Canadian Rational Investor
the_rational_investor@yahoo.com
http://www.therationalinvestor.ca
http://crisdaytrading.blogspot.ca/

Sunday, March 17, 2013

Update for the week of March 8th to March 15th, 2013

Welcome back to CRI's ongoing Crude Oil Day Trading Blog. Price analysis you see (first chart & commentary) is CLJ13, for the week of March 8th to March 15th, 2013. Each trading day (time permitting) a 15 minute chart is added and trades for that day are analyzed:

Market Overview:
The US Dollar index itself is at a very interesting cross roads here. As pointed out in this week's WCTS Blog, we are either at the end of a bearish Bat harmonic pattern (which would imply lower levels from here) or we push up through the 2012 summer peaks (suggesting much higher levels to come). Regardless, the area between 83 to 84 is a very important one and I for one will be keeping a close on how it resolves. While the bond market has yet to be convinced the North American economy has indeed turned, equities are enjoying what appears to be a flight back-into-risk. The fact that all world indices tracked are now pointing higher suggests we are closer to the end of this run then the beginning. Considering seasonality, I wouldn't be surprised if the spring/summer of 2013 marks an important peak. Interestingly, the rally itself is coming from unexpected sectors as our ABG trade (AAPL, Bonds & Gold) takes a break. Indeed, out-performance from sectors like pharmaceuticals shouldn't come as too big a surprise given CRI's 1st 2wks of Q1'13 study suggested that would be the case. Have the metals been beaten up a little too much? Recent WDB Options Model screen results would suggest so as several 'get paid to take a position' trades have emerged of late.

Weekly highlight:
While energy stocks continue to move higher with the broader stock market, Crude oil itself is having a hard time getting going in earnest. We did put in a very tight double bottom (with an associated 'buy' level on the 4 hour charts at 91.60) two weeks ago. This past week confirmed that bottom by moving higher. That bottom was rather 'V' shaped on the daily charts which suggests we ought to at least trade down into that area once again to see if prices really do want to reject moving lower. As for upside objectives, both the daily 50% level and a rather noticeable gap areas are looking to be traded to. Bullish enthusiasm should be tempered at present (as the weekly chart above points out) as price continues its two year consolidation. At some point this market is going to break out and it will be violent. I don't know if it can do so this year before the typical seasonally bullish time of year for commodity prices in general ends. Having said that, May is still two months away and anything can happen before then.
 
Trading Strategy (1 week):
BoT (Break out Trades) I am very comfortable working with my 15m charts and playing double bottoms & tops for moves to either 50% levels or OTE sweet spots. Ideally BoT entries come at or near hourly OTE ss levels. The key with BoT's of late seems to be to only enter a position on a touch of the 13ema following the double top/bottom. Most trades take less than 10 ticks of heat and easily move +30 ticks in the trend's favor. So with this in mind, my trading strategy is to concentrate on BoT entries at or near hourly/4hr OTE levels. If this initial trade entry does not work and I still have confidence in the 15 minute price pattern, I will take my 2nd attempt at the trade at the OTE ss (level with stops 4 ticks below previous significant low). The end reult of this second attempt will mark the end of my trading day regardless. I will finish the day either +$140 (+30 stop hit), +$250 (AOCO +41 hit) or $-310 (personal loss limit hit). I want to focus on 5:30AM to 8:30AM trading window and take every setup that occurs during this window of time.
 
Mental State Review:
While I believe I am ready to take the next step my trading of the past week does not confirm this. I need to be more focused on executing in the setup zones and not making excuses to not perform.
 
Trading Plan:
For some reason I checked out this past. I got stopped out on Monday at my personal loss limit ($-310) made the money back on Tuesday ($+325) and then did literally nothing for the next three days. Finally, late on Friday (more out of frustration then anything else) I took a questionable setup and got stopped out for a $155 loss. So I chewed up three days of my combine for a net $-155 on the week. While not a disaster, I could have done a lot better...
Once again here are my goals for the coming week:
1. At 5:30 be at my post with daily sheet setup done and levels predetermined 
2. Only consider trade to 60m price target with 1st attempt (15m BoT) & 2nd attempt (15 OTE) OR No Alignment = no trading. 3. Take 2 trades each day = 10 trades in total for the week. 4. No Sim or practice account trading. 5, Hold every single trade to either -15 or +41 AOCO level / 60m target. 

That's all for this post, 

Brian Beamish FCSI
The Canadian Rational Investor
the_rational_investor@yahoo.com
http://www.therationalinvestor.ca
http://crisdaytrading.blogspot.ca/

Sunday, March 10, 2013

CLG13 - Update for the week of March 1st to March 8th, 2013

Welcome back to CRI's ongoing Crude Oil Day Trading Blog. Price analysis you see (first chart & commentary) is CLJ13, for the week of Feb. 22nd - March 1st, 2013. Each trading day (time permitting) a 15 minute chart is added and trades for that day are analyzed:

Market Overview: 

On the heels of a better then expected US Employment situation report money flowed out of almost every corner and back into the US. The Fed has gotten what it has wanted, employment is turning and investment dollars are returning to North America. Indeed, even the Canadian dollar managed to 'catch a bid' due to a very strong uptick in its respective employment report. Considering Australia's significant export problem in the face of the collapsing Yen, might there be an long Loonie / short Aussie spread trade in the making here? Weather it be deliberate devaluation or simply an issue of money flows, there currently exists an atmosphere of a race to devalue and as pointed out in this week's CTS Blog Spotlight, this growing inertia may translate into some very big moves. 

Weekly highlight:  

As for Crude Oil itself, prices seem to stabilize this past week. While inventories were relatively bearish, the market kept pressing higher. A wide four hour double bottom was registered on the move through $91.17 midweek and closed Friday on a strong note right at the 50% retracement level of the entire slide. That firm close confirmed a four hour bullish ab=cd price pattern. That patterns implies an upside price target of $93.06. Should that upside inertia hold, additional upside targets include the previous significant peak at $94.46 and the daily price gap at $95.03 (from February) that really ought to be filled in at some point down the road.

Trading Strategy (1 week): 

BoT (Break out Trades) I am very comfortable working with my 15m charts and playing double bottoms & tops for moves to either 50% levels or OTE sweet spots. Ideally BoT entries come at or near hourly OTE ss levels. The key with BoT's of late seems to be to only enter a position on a touch of the 13ema following the double top/bottom. Most trades take less than 10 ticks of heat and easily move +30 ticks in the trend's favor. So with this in mind, my trading strategy is to concentrate on BoT entries at or near hourly/4hr OTE levels. If this initial trade entry does not work and I still have confidence in the 15 minute price pattern, I will take my 2nd attempt at the trade at the OTE ss (level with stops 4 ticks below previous significant low). The end reult of this second attempt will mark the end of my trading day regardless. I will finish the day either +$140 (+30 stop hit), +$250 (AOCO +41 hit) or $-310 (personal loss limit hit). I want to focus on 5:30AM to 8:30AM trading window and take every setup that occurs during this window of time.

Mental State Review:

I am ready to take the next step and now is the time. Stop making excuses and just trade the plan. 

Trading Plan: 

I floundered this past week and regressed. Valid setups came and went and one trade I did in particular wasn't even close to a 'trading plan' trade. To that end I want to concentrate on getting back into two weeks' ago mind set. I have four trading days left on my current combine. Here the are my commitments for the coming four trading sessions:
1. At 5:30 be at my post with daily sheet setup done and levels predetermined 2. Only consider trade to 60m price target with 1st attempt (15m BoT) & 2nd attempt (15 OTE) OR No Alignment = no trading.
3. Take 2 trades each day = 8 trades in total.
4. No Sim or prac account trading.
5, Hold every single trade to either -15 or +41 AOCO level / 60m target.
6. at 50% accuracy = $1640-$600 = +$1040...

On Friday I am going to take the day and review exactly what I did over the previous four days.

Monday's Trade (1-1)
When I woke this AM, I was greeted with a nice 15 minute double bottom in price. This was coupled with an upwardly pointing hourly price chart and a previously well defined four hour bullish price target ($93.06). On a test of the 13ema (15m) I entered long (AOCO -15/+41) as my 1st Attempt (long) of the day at 91.75. Given 91.60 is my stop, I placed my 2nd Attempt (long) just above the double bottom lows (91.58). These two trades will represent my 'attempts' for today. 
Monday's Trade (2-2)
The test of the 13ema proved to be not enough to turn the market back up. My 1st Attempt (long) was stopped out at -15 (so $-155 net combine). My 2nd Attempt open order was placed a little too low and did not get filled on the initial burst lower. After consideration, I moved that order to the OTE ss level (91.65) and was filled at 91.67. This is my second attempt at trading this AM. Regardless of outcome, this ismy last trade in the Combine trading for today.
Monday Review (2-2): I traded my plan and got smoked!. Both long attempts were stopped out. Net loss on the day -$310.

That's all for this post,
Brian Beamish FCSI
The Canadian Rational Investor
the_rational_investor@yahoo.com
http://www.therationalinvestor.ca
http://crisdaytrading.blogspot.ca/

Sunday, March 3, 2013

CLG13 - Update for the week of Feb. 22nd to March 1st, 2013

Welcome back to CRI's ongoing Crude Oil Day Trading Blog. Price analysis you see (first chart & commentary) is CLJ13, for the week of Feb. 22nd - March 1st, 2013. Each trading day (time permitting) a 15 minute chart is added and trades for that day are analyzed:
 
Market Overview: 
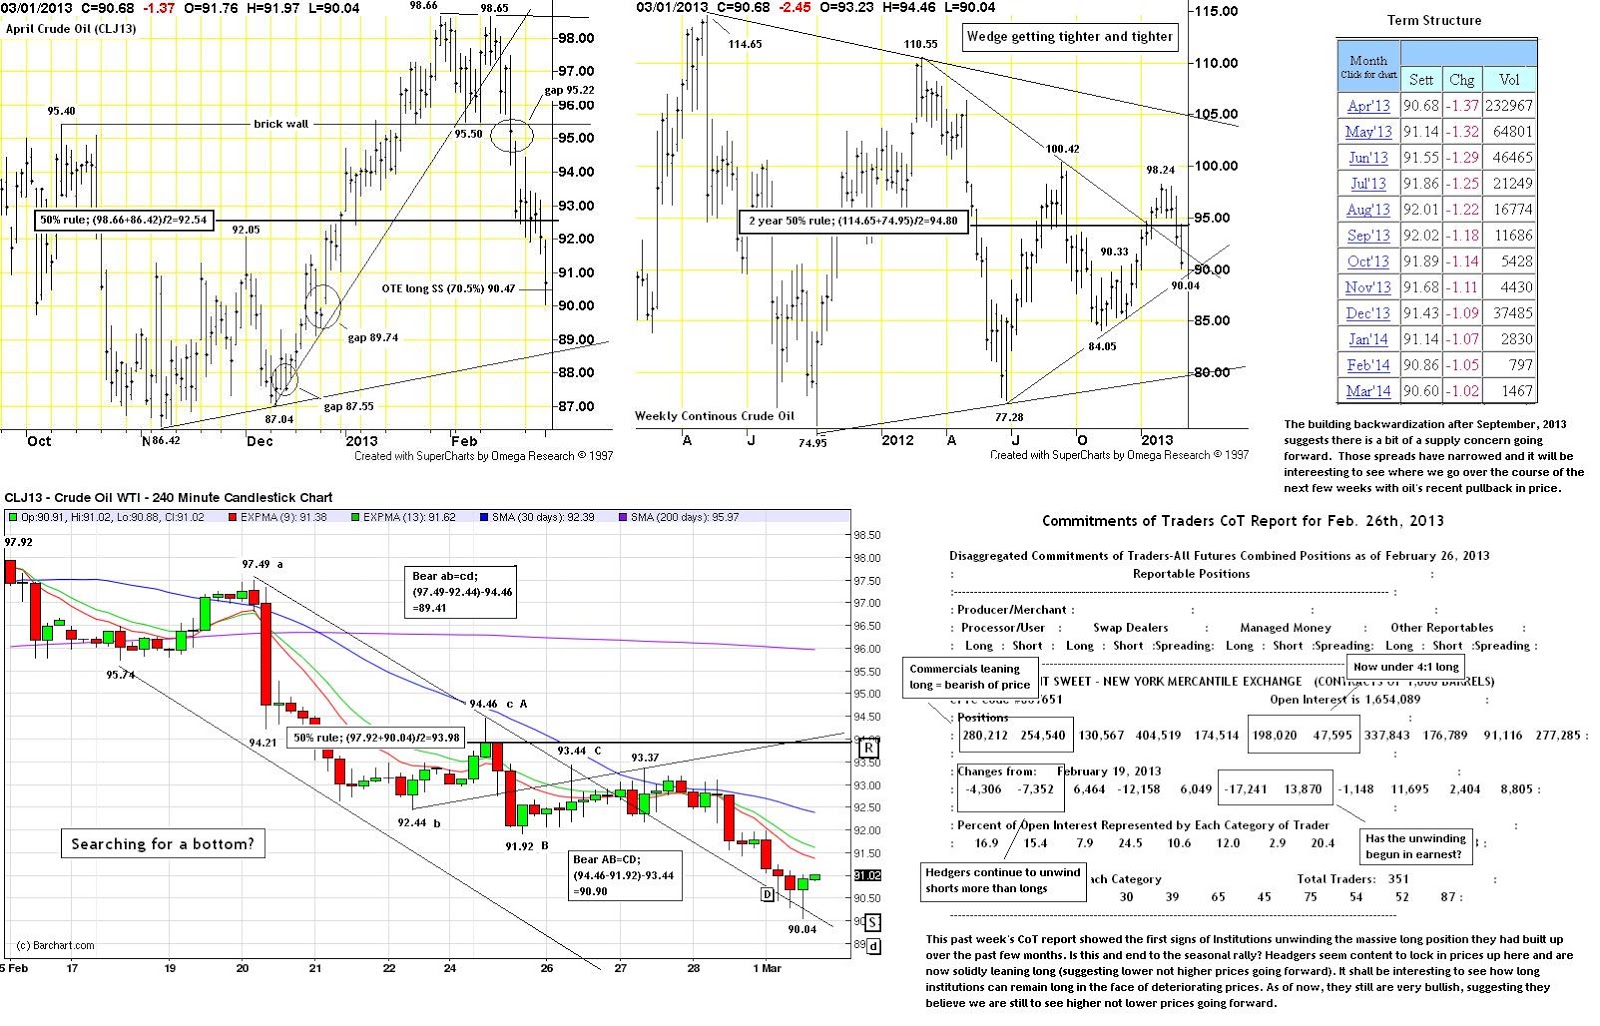
As the pot starts to boil again in Washington we have seen asset prices in general soften and commodity prices in particular break rather hard. The straight line move up from the December lows did seem rather suspicious but not even I expected to see such a violent unwinding to this bull. Over the past month there have been little hints of looming trouble (Commercials turned net bullish two weeks ago for example) and on that change in sentiment a rather well defined double top price pattern was registered. Are institutions caught on the wrong side of the market? Only time will tell, but their overt bullishness (5:1 long over short) seems to have backfired as many have run to the sidelines through this mini melt down bringing that ratio back to just under 4:1 (long over short). Indeed, prices have fallen so much the long side of the market is once again starting to look interesting.

Weekly highlight:  
As for Crude Oil itself, we continued this past week to correct after the well defined double top breakdown in price through the $95.50 area. Two noticable targets remain on the horizon (those being the daily gap at $89.74 and the 4 hour chart bear ab=cd target $89.41) and it feels like we want to ultimately push down into those levels before our next move higher. Having said that, we did just complete an hourly bear AB=CD price pattern (target $90.90) and we are now into the daily OTE Long SS zone ($90.47). We are closer to the bottom then the top. And while it is far too late to sell, at this point it is still a little too early to buy.

Trading Strategy (1 week): 
BoT (Break out Trades) I am very comfortable working with my 15m charts and playing double bottoms & tops for moves to either 50% levels or OTE sweet spots. Ideally BoT entries come at or near hourly OTE ss levels. The key with BoT's of late seems to be to only enter a position on a touch of the 13ema following the double top/bottom. Most trades take less than 10 ticks of heat and easily move +30 ticks in the trend's favor. So with this in mind, my trading strategy is to concentrate on BoT entries at or near hourly/4hr OTE levels. If this initial trade entry does not work and I still have confidence in the 15 minute price pattern, I will take my 2nd attempt at the trade at the OTE ss (level with stops 4 ticks below previous significant low). The end reult of this second attempt will mark the end of my trading day regardless. I will finish the day either +$140 (+30 stop hit), +$250 (AOCO +41 hit) or $-310 (personal loss limit hit). I want to focus on 5:30AM to 8:30AM trading window and take every setup that occurs during this window of time.

Mental State Review:
Personal issues aside, I am very pleased with both my professionalism and work ethic when it comes to my 'day-trading'. I have a realistic goal, an implementable plan to approach the market on a daily basis and most importantly, an 'edge' I have confidence in. At this point It is really just a question of putting the work in, following the plan and reaping the rewards.
 
Trading Plan: 
This past week I spent working on my trading plan in earnest (pdf document link). While it is one thing to analyze where the market may go, it is quite another to have a working 'day-trading' business model that is implementable. To that end, over the past month I have tried to reduce the amount of my trading and set specific rules as to when to enter and exit the market. As a result of these rather ridged trading rules, I found I only traded three out of a possible five days this past week. While my percentage accuracy was low (at only 50%) I finished the week with a very healthy +$500 net balance on a total of 6 trades. I am learning that it is far more important to leave a winner on to 2:1 risk reward ratio level (and be happy with a 50% accuracy if your first attempt should fail) then continually move stops for paltry gains and be right all the time - a very hard lesson for me to learn.

That's all for this post,
Brian Beamish FCSI
The Canadian Rational Investor
the_rational_investor@yahoo.com
http://www.therationalinvestor.ca
http://crisdaytrading.blogspot.ca/

Sunday, February 24, 2013

CLG13 - Update for the week of Feb. 15th to Feb. 22nd, 2013

Welcome back to CRI's ongoing Crude Oil Day Trading Blog. We have officially rolled to the April Crude Oil Contract (CLJ13)
Price analysis you see (first chart & commentary) is CLJ13, for the week of Feb. 15th - 22nd, 2013.
Each trading day (time permitting) a 15 minute chart is added and trades for that day are analyzed:

Market Overview: After a torrid beginning to 2013 one ought not to be too surprised to see some weakness come into the market as it gets ready for the next round of political turmoil out of Washington. Interestingly, these recent 'tops' came in right at expected resistance zones suggesting this market is far more orderly in nature than what the day to day action would suggest.

Weekly highlight:
As for Crude Oil itself, this past week saw prices finally break the long established narrow sideways channel (98.50 to 95.50) that had dominated trade over the past month. Within two trading days the market repriced itself from about $97.50 down to $92.50. While further downside targets do remain (coupled with poor momentum readings) one might argue some sort of reactionary bounce ought to be expected from the rather dramatic plunge. While too early to declare a working bottom, a rally back into the 'brick wall' near $96 shouldn't be unexpected.
 
Trading Strategy (1 week): BoT (Break out Trades) I am very comfortable working with my 15m charts and playing double bottoms & tops for moves to either 50% levels or OTE sweet spots. Ideally BoT entries come at or near hourly OTE ss levels. The key with BoT's of late seems to be to only enter a position on a touch of the 13ema following the double top/bottom. Most trades take less than 10 ticks of heat and easily move +30 ticks in the trend's favor. So with this in mind, my trading strategy is to concentrate on BoT entries at or near hourly/4hr OTE levels. I want to focus on 5:30AM to 8:30AM trading window and take every setup that occurs during this window of time. That is my #1 goal for this coming week.  
Here is a really nice example of one of my BoT trades, how it should have been executed and what I did.
What should have been done (Notice):
1. The origional double bottom in price confirmed by momentum & volume (96.95 area).
2. The 13ema touch 7 bars (1 3/4 hours) later - buy at 97.10 AOCO (-15/+41).
3. Trade took less than 7 ticks heat.
4. AOCO +41 would have been filled next bar.
result: quick trade for relatively little risk
What I did (Notice):
1. I bought on late reaction & subsequent breakout (97.27).
2. Which was far away from the 13ema = poor trade location = mistake.
3. Which led to panic on realization.
4. Which led to getting out at small gain on 200 sma touch at 97.40 (+13). 
 result: I took 13 ticks when there was easily 40 or more for the taking.
 
So what can I take from this review?
1. I have confidence in my 'edge'. I believe.
2. I understand the mechanics of the trading process with appropriate risk/reward levels.
3. I understand my daily risk tolerance (3x15 tick strikes and you are out) and am happy working within the model.

4. I have NOT committed myself to my trading plan. I must commit to it to succeed and this is were I need work.
  
As stated last week:  I want to focus on 5:30AM to 8:30AM trading window and take every BoT setup that occurs during this window of time. That is my #1 goal for this coming week.  
 
Mental State Review: This past week was a poor showing for me. As pointed out in last week's blog, other issues are dominating my personal life right now so it is very hard to commit the time and mental energy to trading that I would like (and really need to) to be successful.  I know this is a long road and there are no easy short-cuts to learning how to trade properly. So with that said, I am committed to the task at hand and will endevour to work through personal problems and not let it effect my trading.....(wish me luck...lol).
Trading Plan:1. BoT (momentum): 

Determine both upper and lower OTE ss entry points on higher time frame (Daily/4Hour/1Hour charts). Find price breakout (typically double bottom/top) confirmed by momentum & volume on 15 minute chart at or near these higher time frame OTE ss entry points. Calculate realistic targets (50%-70.5% retrace into VProf 'Claws'/ma's/gaps on higher time frames). Monitor 13ema on 15 minute chart for entry levels once the breakout has occurred. Look to enter with the prevailing trend (BoT) on touches of the 13ema. Regardless of how long it takes, I can only take a BoT position on that condition. All orders should be entered as AOCO (-15/+41). I can only consider moving the actual stop at +30 (or opposing Keltner band touch). Goal for the week is to 'try' 1 trade per day that meets BoT criteria.

2. ORT & 7RT (time frame range trades):
I will prepare as usual for these daily setups. After about a month of 'forcing' myself to take every setup I have come to appreciate the model, its potential, and its risks. As mentioned above, I will continue to follow the model and indeed take positions, but not if they argue with either a significant counter OTE ss level (meaning the market has moved to a dramatic extreme) or if it is in the face of a prevailing BoT.  

That's all for this post,
Brian Beamish FCSI
The Canadian Rational Investor
the_rational_investor@yahoo.com
http://www.therationalinvestor.ca
http://crisdaytrading.blogspot.ca/

Sunday, February 17, 2013

CLG13 - Update for the week of Feb. 8th to Feb. 15th, 2013

Welcome back to CRI's ongoing Crude Oil Day Trading Blog.
We are within official 'roll' period for day traders - Now in March, 2013 contract (CLH13) will be moving to April, 2013 Contract (CLJ13) this week
Price analysis you see (first chart & commentary) is CLH13, for the week of Feb. 8th - 15th, 2013.
Each trading day (time permitting) a 15 minute chart is added and trades for that day are analyzed:

Market Overview: While pre occupied on another project I have admittedly let my futures trading and this blog take a back seat. Interestingly, I am on the last day of my most recent combine and have (in very typical fashion) about a 1% return on assets over the 10 day period. As long as I continue to post positive trade balances, the good people at TopStepTrader will let me continue to roll my combines at no additional charge. Now that the project has been basically finished, I can once again concentrate on this (and my other free blogs) in earnest once again. As was pointed out in today's CTS, it seems to me the market is in the process of shifting money out of Japan and back into Europe. World economies appear to be on the mend as long term interest rates have begun to move higher of late with surging stock markets. As pointed out in my most recent SPY blog entry, one shouldn't get in the way of bull markets as you just might get run over. With that in mind, there really is no telling where/when the market will run out of steam but considering the Yen has now entered an oversold condition on a weekly basis (a rare occurrence in itself) some sort of short term reversal shouldn't be too unexpected.

Weekly highlight: Crude oil prices have basically gone sideways since the end of January in what can currently be only considered a range bound market. Is this a mid-point consolidation (suggesting much higher prices) or the beginnings of a medium term top (suggesting lower prices)? The 1st 2wks Q1'13 Study suggested energy would see net inflows for the quarter and the January Barometer suggested the market should have a positive tone to 2013. But neither of those studies guarantees a straight line move up or down. Until this range is broken $95 to 98 in earnest, one has no choice but to look to either buy or sell extreme range touches. !5 minute turns near $95 ought to be bought while 15m turns near $97.50 ought to be sold.


Trading Strategy (1 week): BoT (Break out Trades) I am very comfortable working with my 15m charts and playing double bottoms & tops for moves to either 50% levels or OTE sweet spots. Ideally BoT entries come at or near hourly OTE ss levels. The key with BoT's of late seems to be to only enter a position on a touch of the 13ema following the double top/bottom. Most trades take less than 10 ticks of heat and easily move +30 ticks in the trend's favor. So with this in mind, my trading strategy is to concentrate on BoT entries at or near hourly/4hr OTE levels. I want to focus on 5:30AM to 8:30AM trading window and take every setup that occurs during this window of time. That is my #1 goal for this coming week.
 

Mental State Review: I was relieved to finally finish the project that took me away from the market for the better part of a month. I feel refreshed and focused on the task at hand. I have one day remaining on my current $30k combine and shall finish that Tuesday (Monday is a US holiday) and then start in on a new one immediately after. 


Trading Plan:
1. BoT (momentum): 

Determine both upper and lower OTE ss entry points on higher time frame (Daily/4Hour/1Hour charts). Find price breakout (typically double bottom/top) confirmed by momentum & volume on 15 minute chart at or near these higher time frame OTE ss entry points. Calculate realistic targets (50%-70.5% retrace into VProf 'Claws'/ma's/gaps on higher time frames). Monitor 13ema on 15 minute chart for entry levels once the breakout has occurred. Look to enter with the prevailing trend (BoT) on touches of the 13ema. Regardless of how long it takes, I can only take a BoT position on that condition. All orders should be entered as AOCO (-15/+41). I can only consider moving the actual stop at +30 (or opposing Keltner band touch). Goal for the week is to 'try' 1 trade per day that meets BoT criteria.

2. ORT & 7RT (time frame range trades):
I will prepare as usual for these daily setups. After about a month of 'forcing' myself to take every setup I have come to appreciate the model, its potential, and its risks. As mentioned above, I will continue to follow the model and indeed take positions, but not if they argue with either a significant counter OTE ss level (meaning the market has moved to a dramatic extreme) or if it is in the face of a prevailing BoT.  

That's all for this post,
Brian Beamish FCSI
The Canadian Rational Investor
the_rational_investor@yahoo.com
http://www.therationalinvestor.ca
http://crisdaytrading.blogspot.ca/