Sunday, August 4, 2013

Update for the week of August 2nd, 2013

Welcome back to CRI's ongoing Crude Oil Day Trading Blog.

The first picture is daily, weekly and 120 minute charts with Crude Oil's term structure and CoT summary for the week of August 2nd, 2013. Each trading day (time permitting) a 15 minute chart is added and trades for that day are reviewed:


Market Overview: Now that the 'dog days of summer' are here it should come as no surprise to see the currency market go relatively quiet. The latest NFPR number out of the US didn't impress and suggests the recent consolidation in the greenback may continue for a little while longer. Interestingly, the Aussie dollar pushed to new lows suggesting the commodity correction may not be quite done yet. Indeed, it would appear the threat of a historically robust US fall harvest has brought grain prices down and suggests further price depreciation within that sector over the near term.

Weekly highlight: Prices literally jumped out of the gate this past week and didn't really look back until we approached its end. Interestingly, price was NOT able to take out the 2 hour double top high (108.93) high, suggesting the move was more of a low liquidity 'stop run' rather then a genuine bull rally. Bulls would have loved to see price take out those highs and then consolidate - but alas, that was not meant to be. Considering the time of year, it wouldn't surprise me to see some more of these wild price swings through the later part of the summer. The 2 hour OTE long sweet spot (box highlighted on 2 hour chart above) looks like an interesting area to stalk for long positions but until that level is hit, I shall be watching for bear ab=cd patterns (to trade off of) while we work our way down to that target area.
 

Personal highlight: After more than 15 months working at it, I have for the first time successfully completed a TsT 'combine'. I met the stated profit objectives, remained within the very strict risk control thresholds and even met TsT's internal trade report scouting criteria. I am therefore now ready to take the next step in becoming a professional futures trader. I am so proud of myself for 'sticking to it' and not giving up - wtg Brian!
$30k Combine Objectives (10 day)
Profit Objective $1500
> 45% winning days
Avg. hold time of winners longer then avg. losers
Avg. winner > avg. loser
max daily risk $500
max draw down $1500

Screenshot of my combine:
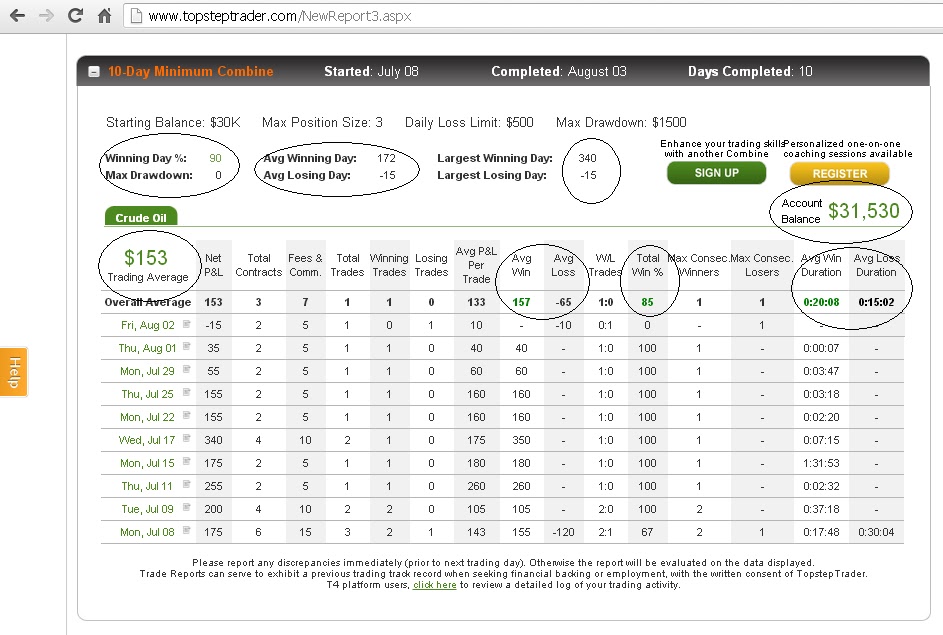


I will openly admit, as I got within earshot of the objectives, I slowed my trading down and took the last 3 days very cautiously. As a result, my profit performance stalled. I believe that the model would have produced far greater profits over the combine period had I just let it take all the valid setups. 

I don't exactly know what the next step is in my journey, but feel very confident in both my trading plan and my personal abilities to be able to take this very marketable skill anywhere opportunity presents itself. It has been a very hard road to travel and I am basking in its fruition.

Trading Plan: I shall talk with Top Step Trader management about what our next steps ought to be and will probably take the coming week to watch more than trade.

That's all for this post, 
Brian Beamish FCSI
The Canadian Rational Investor
the_rational_investor@yahoo.com
http://www.therationalinvestor.ca
http://crisdaytrading.blogspot.ca/

July, 2013 $30k trading plan:

Sunday, July 28, 2013

Update for the week of July 26th, 2013

Welcome back to CRI's ongoing Crude Oil Day Trading Blog.

The first picture is daily, weekly and 120 minute charts with Crude Oil's term structure and CoT summary for the week of July 19th, 2013. Each trading day (time permitting) a 15 minute chart is added and trades for that day are reviewed:


Market Overview: As the summer doldrums role on we saw yet another week of relative quiet trade within the currency space. Indeed, many pairs look much better vs. the greenback as compared to just a few weeks ago. With little significant economic news until Labor day, one does have to look at the next month\'s price action with a bit of a skeptical eye. Is this period of calm setting us up for some serious fireworks come this fall? Elsewhere, grain prices continue to fall as the looming 2013 historically large harvest draws closer. With little news of drought or floods, the market is now pricing in a very big crop.

Weekly highlight: This past week saw the market slowly take back a large portion of the blow off top that took us up above $108. As pointed out previously, that level was a significant bullish price objective so it shouldn't have come as too big of a surprise to see us consolidate the rather impressive gains seen over the past few weeks. Two significant short term targets remain to the downside (the 'C' point low of 103.73 and the Daily gap at 103.31) and shall be my bearish target area for the coming week. A 50% retracement of the sell off (assuming these lows hold) would take us up into the 106 to 107 area and that shall be my bullish target area for the coming week.
 

Trading Plan: For this coming week I plan to trade at least 3 of the upcoming 5 possible sessions and only once per trading time frame. I booked 31 ticks in profits last week (trading 2 of a possible 5 sessions and once per day) and need just 5 ticks net to reach my current combine's profit goal. All trade considerations will be of the AB=CD model setup and will follow strict trade management rules. I shall risk being wrong only once per trading day and will only risk 11 ticks per trade. This will equate to a total of 3 trades for the coming week. Follow the model, take valid setups and move stops according to preset rules...

Probable outcomes:
0% - 3/3 (3 x -11.5) =  -34.5 ticks (miss combine objective by 30 ticks - qualify for roll over)
33% - 1/3 (2 x -11.5) + (1 x  20) = -3 ticks (miss combine objective by 8 ticks - qualify for roll over)
66% - 2/3 (1 x -11.5) + (2 x 20) = +37.5 ticks (meet combine objective - take next step with TsT)
100% - 3/3 3 x 20 = +60 ticks (meet combine objective - take next step with TsT)

I will admit, if I hit the profit objective on either the first or second day, I will probably book 1 tick losses for any remaining days to ensure success.

That's all for this post, 
Brian Beamish FCSI
The Canadian Rational Investor
the_rational_investor@yahoo.com
http://www.therationalinvestor.ca
http://crisdaytrading.blogspot.ca/

July, 2013 $30k trading plan:


Sunday, July 21, 2013

Update for the week of July 19th, 2013

Welcome back to CRI's ongoing Crude Oil Day Trading Blog.

The first picture is daily, weekly and 120 minute charts with Crude Oil's term structure and CoT summary for the week of July 19th, 2013. Each trading day (time permitting) a 15 minute chart is added and trades for that day are reviewed:


Market Overview: There was little significant change seen across currency land this past week suggesting recent price action is range bound for the time being. Seemingly cheering this relative calm, commodity markets continued the general bounce coming out of the 1st 2wks of Q3\'13. Energy prices seem to be leading the surge of late as Crude Oil has hit and exceeded both daily and weekly price objectives. Of particular note this week, Cotton looks to be setting up an interesting weekly long AB=CD pattern and presenting a 3:1 reward to risk trade - something for CRI\'s OnlyDoubles Trade blog to take a serious look at.

Weekly highlight: Price steadily marched higher over the course of last week ultimately hitting the rather well defined Bull ab=cd price objective of 108.05. Indeed, price spike momentarily higher, only to fail through the course of Friday's weekly options expiry and industry's roll out of August and into September contracts.

While upside price objectives have been hit and even exceeded on all three time frame charts referenced above (120 minute, Daily and Weekly) both the daily and weekly charts are firmly pointing up and could still move higher should the economic data and or geopolitical news warrant.  I shall be looking initially for a test of the 106 area (120 minute 50% level and key lows) but should that level fail a nice test of the uptrend line (outlined on the 120 minute chart above) corresponds with the 1-4 hour OTE long sweet spot and would be an ideal level to consider getting back in on the long side of this market.
 

Trading Plan: Along with my very strict momentum model setup I now use a harmonic ab=cd price pattern setup. Both models are conservative and relatively reliable (far greater than 50% accuracy). 

For this coming week I plan to trade at least once per trading time frame. I don't expect a strict momentum trade to develop and anticipate all trades to be of the ab=cd model. My goal for the week is to net 50 ticks. I will not risk more than 20 ticks per trading day. Follow the model, take valid setups and move stops according to preset rules...
expected 20-30 tick reward (25)
expected risk 10-15 (12.5)
expected trades: 10
expected performance 60%
6 x 25 = 150
4 x 12.5 =  50
= +100 ticks

That's all for this post, 
Brian Beamish FCSI
The Canadian Rational Investor
the_rational_investor@yahoo.com
http://www.therationalinvestor.ca
http://crisdaytrading.blogspot.ca/

July 21, 2013 L&B $30k combine trading plan:

Cheers

Sunday, July 7, 2013

Update for the week of June 28th, 2013

Welcome back to CRI's ongoing Crude Oil Day Trading Blog.

The first picture is daily, weekly, 180 minute charts with term structure and CoT summary for the week of July 05th, 2013. Each trading day (time permitting) a 15 minute chart is added and trades for that day are reviewed:


Market Overview: The US Dollar forged to new highs this past week on optimism about the US economy and the prospects for higher not lower US interest rates going forward. Additionally, the greenback has caught a \'fear bid\' as it appears instability within Egypt has once again captured the world\'s attention. Interestingly, NyMex Crude Oil surged (on that instability) & hit its weekly upside price target - seemingly the only bullish commodity chart I can see at the moment. As has been previously highlighted, both the commodity currencies (the Aussie & Cdn. dollars) continue to see heavy downside pressure. Indeed, the two appear to be the focus of this latest round of global currency re-balancing as the world\'s appetite for commodities in general wanes.

Weekly highlight: Large institutions appear to finnally be getting paid for their recent overt bullishness. Prices moved dramatically higher through the week as the double bottom form late last week held and extended through the all important 99.21 peak (from June 19th). Several bullish ab=cd price patters appear to be at work suggesting futher upside price pressure is in the works for the coming sessions. Considering too, that this is the first two weeks of Q3'13, fund managers appear to be loading up on Crude oil in particular as price has basically moved straight up through the entire first week of the quarter. It shall be interesting to see if price calms through the end of this week or if we continue at this torid pace.


It is very important to note, given the light holiday sessions and the end of Q2'13, I would be reluctant to hold any position or significant bias in earnest until we are on the other side of the holiday and indeed, the first two weeks of Q3'13.
 

Trading Plan: Along with my very strict momentum model setup I added a play/setup off harmonic ab=cd price patterns.Both models are conservative and relatively reliable (far greater than 50% accuracy) so I am very excited about my new combine that shall start Monday morning. Follow the models, take valid setups and move stops according to preset rules...

That's all for this post, 
Brian Beamish FCSI
The Canadian Rational Investor
the_rational_investor@yahoo.com
http://www.therationalinvestor.ca
http://crisdaytrading.blogspot.ca/

July, 2013 L&B $30k combine trading plan:
Monday July 8th:
Today was a productive day (3/3) for +17.5 ticks net. For those interested, here is a picture of a bullish AB=CD Harmonic Price pattern and the 'bot' trade entry setup:

Sunday, June 30, 2013

Update for the week of June 28th, 2013

Welcome back to CRI's ongoing Crude Oil Day Trading Blog.

The first picture is daily, weekly, 120 minute charts with term structure and CoT summary for the week of June 28th, 2013. The Second picture is the weekly Volume Profile with price overly. Each trading day (time permitting) a 15 minute chart is added and trades for that day are reviewed:


(no Volprofile chart available this week)

Market Overview: As the notion of the end of the US Fed's QE program gains hold, 'risk' assets seem to be slowly deflating at the same time as bond prices do too. While some may have seasonal (grains) or geopolitical (Crude Oil & products) forces supporting price at the moment, the general distaste for anything commodity related can be clearly seen within our two commodity proxy currencies, The Canadian and Australian dollars. Both have 'broken down' and now the Canadian stock benchmark has broken down in earnest too - not a good sign for commodity bulls. Lastly, our Professor of Economics (HG Copper) forged to new lows this past week, seemingly confirming our bearish macro-economic scenario.

Weekly highlight: The post options expiry sessions did indeed see a bottom finally come in at 92.67 only to see price violently move right back up to 50% of the entire move. Subsequent selling pressure couldn't take the market lower and as a result an interesting bull ab=cd developed through the week. Its target was hit and exceeded briefly, only to see price fail both into the Friday weekly options expiry, and Q2'13 quarter end. From a geopolitical perspective, Egypt appears on the brink of civil war and that may have put 'a bid' into the market following the all important June '13 options expiry last week.

It is very important to note, given the light holiday sessions and the end of Q2'13, I would be reluctant to hold any position or significant bias in earnest until we are on the other side of the holiday and indeed, the first two weeks of Q3'13.
 

Trading Plan: Along with my very strict momentum model setup (refer to last week's blog for more on that) I am going to add a play/setup off harmonic ab=cd price pattern going forward. I have long been a fan of the ab=cd price pattern but have found it very hard to use with regard to risk / reward ratios (following the ab=cd marks alone). I recently found a very helpful tool (produced by the good people at Netpicks.com) that has greatly increased my confidence in taking positions off these patterns....ty netpicks....

AB=CD Model setup
1. $.50 initial/primary move in price.
2. Consolidation back to at least 33% but no more than 66% of that move (about .25).
3. Combination of '3 bar pattern' & 'trendline break pattern' on 3m chart.
4. Move to Fib/Harmonic AB=CD OTE Trade Entry Calculation (TEC). Initial Reward to risk on all ab=cd setups should be 3:1 and all levels should be known ahead of time. Enter orders AOCO initially then move stops as model indicates.
Where TEC (A, B and C  are known and price moves through MA's from point A to B):
Bull ab=cd;
D = (B-A)+C
Entry = [.25(D-C)]+C (price is brushing down against MA's as support)
Initial Stop = C-1tick
Profit Target = D
Move Stop to b/e at [.66(D-C)]+C
*Move Stop to 'trailing 5 ticks' at D -10 hit.
Bear ab=cd;
D = (A-B) - C
Entry = [.25(C-D)]-C (price is brushing up against MA's as resistance)
Initial Stop = C+1tick
Profit Target = D
Move Stop to b/e at [.66(C-D)]-C
*Move Stop to 'trailing 5 ticks' at D +10 hit.

(*not entirely sure as to this trailing stop strategy and will fine tune over coming sessions)

I just finished my most recent combine ($30k 10 day) with a positive account balance and meeting 2/3 metrics required by TsT to qualify for a 'roll over'.....yay Brian! While still not 'funded' yet, I must take some pride in this being my 16th combine and never 'blowing one up' yet.....wtg Brian...With all this in mind, and the very light holiday sessions to come, I shall NOT begin my next official combine until at least the week starting July 15th. For the next 2 weeks I shall be paper trading my two models (listed above and in my trading plan) and getting more comfortable using just these two setups through my trading day.....

That's all for this post, 
Brian Beamish FCSI
The Canadian Rational Investor
the_rational_investor@yahoo.com
http://www.therationalinvestor.ca
http://crisdaytrading.blogspot.ca/

July, 2013 L&B $30k combine trading plan:

Sunday, June 23, 2013

Update for the week of June 21st, 2013

Welcome back to CRI's ongoing Crude Oil Day Trading Blog.

The first picture is daily, weekly, 120 minute charts with term structure and CoT summary for the week of June 14th, 2013. The Second picture is the weekly Volume Profile with price overly. Each trading day (time permitting) a 15 minute chart is added and trades for that day are reviewed:


  (courtesy of http://www.sdfanalytics.com/)

Market Overview: This past week saw the June, 2013 options expiry (amid a quadruple witching Friday) come and go with a bang. Few asset classes did well in the face of a reported potential end to the US Federal Reserve Board's QE program but commodities took it especially hard as mass long liquidation brought prices down basically across the board. Yet into that selling, few new trends were established. As we head into the end of Q2'13 and the beginning of Q3'13 it is interesting to see that even amid significant downside price pressure, Energy (ex. Nat. Gas) and Grain markets held recent support levels and even look poised to move higher. Having said that, both our commodity currencies (the Aussie & Canadian dollars) look weak at this point, so I am not overtly bullish of the sector just yet. Indeed, this 'Sell in May and walk away', may take some time to play itself out to fruition.

Weekly highlight: Crude oil this past week hit its daily July bull ab=cd target (and missed August's by less then 10 ticks) and then promptly collapsed into the options expiry. Talking heads may point the blame at Fed talk of an end to QE but my hunch is the market was heavily long and due for a pull-back. The option's expiry itself was the catalyst and indeed prices began to break in earnest Thursday (the day prior to options expiry) and that usually is when the big options players do most of their significant business. Considering TPO's rather small volume prints below $97.25 I do not believe the market has accepted low. I shall be looking for a bounce back to the 50% level (96.16) through the coming week and ultimatly back up into the significant volume nodes in and around $97.25. But, If the market fails to recapture the significant low of 94.29, I shall be looking for price to move below $90 in the not too distant future. 


It is very important to note, given the light holiday sessions and the end of Q2'13, I would be reluctant to hold any position or significant bias in earnest until we are on the other side of the holiday and indeed, the first two weeks of Q3'13.
 

Trading Plan: As I outlined in last week's blog post, I have focused my trades on only one setup now and I find my confidence as risen appreciably. This had been a big stumbling block for me as with little confidence in my setups I was often tempted to 'get out' too early and leave substantial profits on the table. While I did commit that very sin on Friday (took 6 ticks by moving my stop early when +45, my default AOCO level, was hit rather easily) seeing the end result of this setup leaves me with much greater confidence to hold positions a little longer. Indeed, my 3m models suggests one ought to hold a position for at least 4 bars past the momentum double bottom/top. Since it kept on making higher highs off higher lows, momentum would have had me long right up to +100 ticks (wow!).

Here then is a screen shot of that setup (of which I want to concentrate on finding/hunting for through coming sessions):

This is the basic outline for my Momentum trade strategy:

Setup Management
1. Price must have entered a valid 1 to 4 hour OTE sweet spot (70.5% retrace of primary move)
2. 15m & 1hr MA relationships support a profitable trade setup (ie price has room to move to 15m/1hr support/resistance with momentum confirmation
3. Watch for 15m doji (ideally in and around TF trade locations and less then 15 ticks)
4. Move to 3m 
  1. Wait for Momentum divergence/acceptance to develop.
  2. Find 3m VolProfile/Trendline/Gap/AB=CD targets & 15m/1hr MA sup&res/Fib/H&L levels and only enter trade IF reward is at least two times risk.
  3. Draw trend line defined by that range
  4. Price must close 3m bar above/below that trend line for trade setup 
  5. Take position on trade 1 tick below/above h/l of bar that closes above/below trend line & stop (-.15) is above/below 2 previous sig res/sup levels.
 6. When you see valid setup - you must GO!

Trade Execution
1. Enter order on AOCO basis (-15/+45)
2. Once order entered leave to fruition.

Risk / Reward management
1. I can only move my stop once +30 (or twice what I am willing to risk) has been hit
2. I must force myself to consider every time frame (TF trade location) as a possible trade opportunity (5AM pst, 6AM pst, 7AM pst, 8:30AM pst, 11:30AM pst)  
3. Two strikes (-15 ticks each) and you are out (-$310 max loss on day) 
4. Daily goal is +45 ticks (or +$450 profit on day)

That's all for this post, 
Brian Beamish FCSI
The Canadian Rational Investor
the_rational_investor@yahoo.com
http://www.therationalinvestor.ca
http://crisdaytrading.blogspot.ca/

Sunday, June 16, 2013

Update for the week of June 14th, 2013

Welcome back to CRI's ongoing Crude Oil Day Trading Blog.  

The first picture is daily, weekly, 120 minute charts with term structure and CoT summary for the week of June 14th, 2013. The Second picture is the weekly Volume Profile with price overly. Each trading day (time permitting) a 15 minute chart is added and trades for that day are reviewed:


 (courtesy of http://www.sdfanalytics.com/)


Market Overview: Has the monster correction within the European currency space finally come to an end? This past week\'s price action would suggest so. The Euro and B. Pound are now pointing higher and the Swiss Franc looks to be shortly along the way. Interestingly, the only sector within the commodity space that looks like it wants to follow along is the energy complex (ex N. Gas). Within that space Crude Oil and Heating Oil look ready to go with Rbob trying to turn as well. Sadly, looks like the consumer is going to feel this summer\'s rise in energy costs right in the pocket book. But in the same breath, that rise in energy prices may act as a natural break on the economy relieving the US Fed from having to do too much heavy lifting.

Weekly highlight: This past week saw the Crude Oil market finally breakout to the upside. This consolidation has been very long and and trying for day traders. We now may be entering a 'trending' market which makes for some interesting 'trend following' trade opportunities. Considering the Geo-political situation around the middle east, a test of the $100/barrel level shouldn't be too unexpected. Considering too the overtly bullish stance the 'smart money' has had for some time now, it looks like they are finally going to get paid for their patients.
 
Trading Plan: I am following my trading plan (pdf link) closely of late and that in itself is a good progression. My trades this past week were defined and disciplined. Having said that, it would appear that some of my setups are still a bit vague and need work. I took a 'panic' setup early in the week only to see if fail after realizing the trade I took was on the heals of a completed 'panic' trade just a few hours previous. I took an OTE long in the face of a very bearish 15m momentum backdrop and that trade too failed (-28 ticks total on the two trades). The following day (Wed.) I again followed my plan and took the 7AM range trade in which I took both legs of the trade setup heading into the weekly EIA inventory report which in itself wasn't a smart chance to take (-32 ticks). I made up ground on Thursday with a very well timed momentum trade that netted +32 ticks in just under 2 minutes.

With this experience in mind, I think I am going to concentrate on the one solid setup I have working at the moment and that is my momentum trade. This is the basic outline for my Momentum trade strategy:

Setup Management
1. Price must have entered a valid 1 to 4 hour OTE sweet spot (70.5% retrace of primary move)
2. 15m & 1hr MA relationships are in same direction with momentum confirmation
3. Watch for 15m doji (ideally in and around TF trade locations)
4. Move to 3m 
  1. Wait for Momentum divergence/acceptance to develop.
  2. Draw Fibs off previous swing range - 38.2, 50 & 70.5
  3. Draw trend line defined by that range
  4. Take position on trade 1 tick below/above h/l of bar that closes above/below trend line & stop (-.15) is above/below 2 previous sig res/sup levels.

Find VolProfile/Trendline/Gap/AB=CD targets and only enter trade IF reward is at least two times risk.

Trade Execution
1. Enter order on AOCO basis (-15/+45)
2. Once order entered leave to fruition.

Risk / Reward management
1. I can only move my stop once +30 (or twice what I am willing to risk) has been hit
2. I must force myself to consider every time frame (TF trade location) as a possible trade opportunity (5AM pst, 6AM pst, 7AM pst, 8:30AM pst, 11:30AM pst)  
3. Two strikes (-15 ticks each) and you are out (-$310 max loss on day) 
4. Daily goal is +45 ticks (or +$450 profit on day)

That's all for this post, 
Brian Beamish FCSI
The Canadian Rational Investor
the_rational_investor@yahoo.com
http://www.therationalinvestor.ca
http://crisdaytrading.blogspot.ca/