Sunday, January 20, 2013

CLG13 - Update for the week of January 11th through January 18th, 2013

Welcome back to CRI's ongoing Crude Oil Day Trading Blog.
We are within official 'roll' period for day traders - Now in March, 2013 contract (CLH13)
Price analysis you see (first chart & commentary) is CLH13, for the week of Jan. 11th - 18th, 2013.
Each trading day (time permitting) a 15 minute chart is added and trades for that day are analyzed:

Market Overview: In a week that saw little movement in the US Dollar index itself, that can't be said of its major trading partners. While the Yen continues to search for support there are tells out of Europe that maybe the Euro (and its trading partners) are starting to run out of upside steam. Regardless, during times like these (where international currencies are searching for new trading levels) small investors are best to leave the whole thing alone. Trying to out-guess the market, and even going as far as to declare a certain point as 'the bottom' is foolish at best and can be rather financially taxing at worst. Given too our seasonality model (US Presidential election year cycle) suggests weakness after the inauguration and the fact that we have the back half of January ahead of us (re. January Barometer) one shouldn't be too surprised to see a period of 'back-filling' over the coming weeks - caution is currently warranted..

Weekly highlight: Crude Oil continued its steady march higher through the week hitting an intraday high of $96.50 and then backing off into the weekend. Based on recent CoT data (where Institutions have moved out to a 5:1 long over short bias) it seems institutions must have seen a fall in the US Dollar index coming, a bullish fundamental backdrop for CL demand building, and a general resumption of a 'risk on' atmosphere returning to the market. But that now is looking backwards. As of Friday's close we seem to have stalled a bit up top here and I think there are a few justifiable reasons why:
1. The seasonal US Presidential election cycle rally usually stalls after the January inauguration. 2. As well as our regular Triple witching, we have a Leap option series (Jan. 2013) expiry this Friday. 3. The back half of January's price action is often weak as it usually hints at what the second half of the year ought to look like (per the January Barometer). 4. Technically (for February NYMEX Crude Oil), $94.87 was a significant peak from back in October and appears to still remain as a significant resistance point at present. Indeed, a pullback from current levels back into the high 80's may be setting up an Inverted Head & Shoulders pattern. Additionally, the rally has brought us right up to a major downtrend line on the weekly charts. To add a further cautionary note, daily and weekly 50% levels have been exceeded so are no longer supportive of higher price action. 5. With institutions so heavily biased to the long side, is it not realistic to look for some sort of profit taking on their part? And, can we expect them to go to even further extremes? You can only stretch the proverbial rubber band so far.... Put all these 'backdrops' into place and one shouldn’t be surprised to see price consolidate for a bit at this point.
 
Trading Strategy (1 week): BoT (Break out Trades) have been very successful of late. The primary change I have made (which has enhanced performance remarkably) is to NOT buy/sell the actual breakout but to wait for the subsequent test of the 13 period exponential moving average on the fifteen minute chart. I have seen this come in on the next 15 minute bar and I have seen it come in after 20, 15 minute bars. Price often reverses after the counter trend 13ema touch, and the trade resumes its 'breakout direction'. While stops do occur, I have 'tracked' this trading model take on average 5-10 ticks of heat before reversing back in my favor. Considering the volatility of the current market, .40 with-trend swings from the 13ema seem to happen quite often so hence my interest in that level to look to take profits. I will though, get very skittish about holding a position that is either above/below the 13ema Keltner Bands. Put together, I feel comfortable trading this system and that makes me feel good too. 
Conversely, ORT's have been very difficult trades of late and as a result, the profits seen through the beginning of December have not materialized as anticipated. The problem with any statistical model is the amount of inputs. For a model to be deemed statistically relevant one must have a massive amount of inputs to offset short term anomalies. Interestingly, December saw an inordinate number of winning trades. I suppose to bring that statistical model back into historical 'norm' we needed a period of inordinate loses. I believe that is what is happening now. Interestingly many of the traders that work with or are associated with TopStepTrader themselves either were simply not trading or were very reticent about positions this time of year. I hear one gentlemen recently flatly state that he was very reluctant to do any trading until after the first NFPR of the year is released! I too am coming to appreciate how dangerous and 'non-normal' the period around Christmas can be for day traders. Position traders can take advantage of short term 'air pockets'; day traders can too; but you better know exactly what to expect and how to play it. With all that said, I will approach the ORT & 7RT trades with a little more caution going forward. With the idea that BoT's are often a good proxy for  general market direction, I want to start taking the ORT & 7RT trades that agree with the current BoT pattern. And if the RT 'buy' level is far away from 13ema; LEAVE IT ALONE. I fully expect to miss a few of the range trades but I simply can't be so cavalier in the face of conflicting BoT levels...
 

Mental State Review: As per last blog entry, ORT losses have been rather significant of late. So much so, that I am reluctant to participate until I start to see some regularity again. If I am going to take a range trade for the coming week, it must agree with BoT analysis or I won't take it. Sometimes the best offense is a really good defense. While the daily loss limit of the reduced combine ($30k with max daily risk of $500) has been hard to work with, I find my '3 strikes' rule keeps me honest. Daily loss limit must not exceed $465 (3 losing trades at 15 ticks each plus $5 commissions per trade = - $465). This number in itself scares me a little (being so close to the risk threshold) that I have found of late that if I find myself with 2 losers and in and around $300 in losses, I may just call it a day and wait for the next to trade again. 

Trading Plan:
1. BoT (momentum): 

Determine bother upper and lower OTE ss entry points on higher time frame (Daily/4Hour/1Hour charts). Find price breakout (typically double bottom) confirmed by momentum & volume on 15 minute chart at or near these higher time frame OTE ss entry points. Calculate realistic targets (50%-70.5% retrace into VProf 'Claws'/ma's/gaps on higher time frames). Monitor 13ema on 15 minute chart for entry levels once the breakout has occurred. Look to enter with the prevailing trend (BoT) on touches of the 13ema. Regardless of how long it takes, I can only take a BoT position on that condition. All orders should be entered as AOCO (-15/+41). I can only consider moving the actual stop at +30 (or opposing Keltner band touch). Goal for the week is to 'try' 1 trade per day that meets BoT criteria.

2. ORT & 7RT (time frame range trades):
I will prepare as usual for these daily setups. After about a month of 'forcing' myself to take every setup I have come to appreciate the model, its potential, and its risks. As mentioned above, I will continue to follow the model and indeed take positions, but not if they argue with either a significant counter OTE ss level (meaning the market has moved to a dramatic extreme) or if it is in the face of a prevailing BoT.  

That's all for this post,
Brian Beamish FCSI
The Canadian Rational Investor
the_rational_investor@yahoo.com
http://www.therationalinvestor.ca
http://crisdaytrading.blogspot.ca/

Sunday, January 13, 2013

CLG13 - Update for the week of January 04th through January 11th, 2013

Welcome back to CRI's ongoing Crude Oil Day Trading Blog.
After a much needed break, CRI's CL day trading blog is back up and running.
Price analysis you see (first chart & commentary) is CLG13, for the week of Jan. 4th - 11th, 2013.
Each trading day a 15 minute chart is added and trades for that day are analyzed:


Market Overview: The beginning of 2013 has seen a break in both 'fear' proxies (US$ Index & Jap. Yen) on a massive inflow into the Euro & Euro related currencies. This action has come on the heals of better than expected economic data (US/China in particular) but also too on comments from ECB officials suggesting the worst may be behind the Euro zone - at least for now. Is this the start of a new global economic up-leg? That may be too soon to declare but one thing is for sure, based on our time tested 1st 2wks of the Quarter Study (Q1'13) we can conclude that for the first quarter of 2013, institutional money is definitely flowing towards 'risk assets' rather than away from them.

Weekly highlight: Crude Oil continued its steady march higher through the week hitting an intraday high of $94.70 and then backing off into the weekend. Based on recent CoT data
(where Institutions have moved out to a 5:1 long over short bias) it seems institutions must have seen a fall in the US Dollar index coming, a bullish fundamental backdrop for CL demand building, and a general resumption of a 'risk on' atmosphere returning to the market. But that now is looking backwards. As of Friday's close we seem to have stalled a bit up top here and I think there are a few justifiable reasons why:

1. The seasonal US Presidential election cycle rally usually stalls after the January inauguration.
2. As well as our regular Triple witching, we have a Leap option series (Jan. 2013) expiry this Friday.
3. The back half of January's price action is often weak as it usually hints at what the second half of the year ought to look like (per the January Barometer).
4. Technically (for February NYMEX Crude Oil), $94.87 was a significant peak from back in October and appears to still remain as a significant resistance point at present. Indeed, a pullback from current levels back into the high 80's may be setting up an Inverted Head & Shoulders pattern. Additionally, the rally has brought us right up to a major downtrend line on the weekly charts. To add a further cautionary note, daily and weekly 50% levels have been exceeded so are no longer supportive of higher price action.
5. With institutions so heavily biased to the long side, is it not realistic to look for some sort of profit taking on their part? And, can we expect them to go to even further extremes? You can only stretch the proverbial rubber band so far....
Put all these 'backdrops' into place and one shouldn’t be surprised to see price consolidate for a bit at this point.

Trading Strategy (1 week): BoT (Break out Trades) have been very successful of late. The primary change I have made (which has inhanced performance remarkably) is to NOT buy/sell the actual breakout but to wait for the subsiquent test of the 13 period exponential moving average on the fiftenn minute chart. I have seen this come in on the next 15 minute bar and I have seen it come in after 20, 15 minute bars. Price often reverses after the counter trend 13ema touch, and the trade resumes its 'breakout direction'. While stops do occure, I have 'tracked' this trading model take on average 5-10 ticks of heat before reversing back in my favor. Considering the volatility of the current market, .40 with-trend swings from the 13ema seem to happen quite often so hence my interest in that level to look to take profits. I will though, get very skittish about holding a position that is either above/below the 13ema Keltner Bands. Put together, I feel comfortable trading this system and that makes me feel good too. 

Conversely, ORT's have been very difficult trades of late and as a result, the profits seen through the beginning of December have not materialized as anticipated. The problem with any statistical model is the amount of inputs. For a model to be deemed statistically relevant one must have a massive amount of inputs to offset short term anomalies. Interestingly, December saw an inordinate number of winning trades. I suppose to bring that statistical model back into historical 'norm' we needed a period of inordinate loses. I believe that is what is happening now. Interestingly many of the traders that work with or are associtaed with TopStepTrader themselves either were simply not trading or were very reticent about positions this time of year. I hear one gentlemen recently flatly state that he was very reluctant to do any trading until after the first NFPR of the year is released! I too am coming to appreciate how dangerous and 'non-normal' the period around Christmas can be for day traders. Position traders can take advantage of short term 'air pockets'; day traders can too; but you better know exactly what to expect and how to play it. With all that said, I will approach the ORT & 7RT trades with a little more caution going forward. With the idea that BoT's are often a good proxy for  general market direction, I want to start taking the ORT & 7RT trades that agree with the current BoT pattern. And if the RT 'buy' level is far away from 13ema; LEAVE IT ALONE. I fully expect to miss a few of the range trades but I simply can't be so cavalier in the face of conflicting BoT levels...

Mental State Review: As per last blog entry, ORT losses have been rather significant of late. So much so, that I am reluctant to participate until I start to see some regularity again. If I am going to take a range trade for the coming week, it must agree with BoT analysis or I won't take it. Sometimes the best offense is a really good defense. While the daily loss limit of the reduced combine ($30k with max daily risk of $500) has been hard to work with, I find my '3 strikes' rule keeps me honest. Daily loss limit must not exceed $465 (3 losing trades at 15 ticks each plus $5 commissions per trade = - $465). This number in itself scares me a little (being so close to the risk threshold) that I have found of late that if I find myself with 2 losers and in and around $300 in losses, I may just call it a day and wait for the next to trade again. 


Trading Plan:
1. BoT Criteria: Determine bother upper and lower OTE ss entry points on higher time frame (Daily/4Hour/1Hour charts). Find price breakout (typically double bottom) confirmed by momentum & volume on 15 minute chart at or near these higher time frame OTE ss entry points. Calculate realistic targets (50%-70.5% retrace into VProf 'Claws'/ma's/gaps on higher time frames). Monitor 13ema on 15 minute chart for entry levels once the breakout has occured. Look to enter with the prevailing trend (BoT) on touches of the 13ema. Regardless of how long it takes, I can only take a BoT position on that condition. All orders should be entered as AOCO (-15/+41). I can only consider moving the actual stop at +30 (or opposing Keltner band touch). Goal for the week is to 'try' 1 trade per day that meets BoT criteria.

ORT & 7RT:
I will prepare as usual for these daily setups. After about a month of 'forcing' myself to take every setup I have come to appreciate the model, its potential, and its risks. As mentioned above, I will continue to follow the model and indeed take positions, but not if they argue with either a significant counter OTE ss level (meaning the market has moved to a dramatic extreme) or if it is in the face of a prevailing BoT.  

That's all for this post,
Brian Beamish FCSI
The Canadian Rational Investor
the_rational_investor@yahoo.com
http://www.therationalinvestor.ca
http://crisdaytrading.blogspot.ca/


Monday's Trade (3-3 +$325 Prac Ac)

Since I had a number of non-market related things to take care of today (and I would be away for most of the NYPit session) I made it a point not to trade my combine today. I did notice through the London Kill Zone a very well defined rally into the hourly OTE Short SS (94.11) and then a subsiquesnt OTE Short SS setup on the 15minute chart develop (94.15). This got me quite excited and even though I had made a business decision not to trade today (refer to above) I still wanted to try and get a short on up in this neighborhood. I did it in my practice account in exact same fashion I would have done in my combine. It took three attempts to get the short position on and working. The first (and is often the case with me, was a little hasty and ended up failing. The second attempt couldn't punch through the 13ema on the way down so I liquidated on the understanding that any rally away from that moving average would be a short. It made a small amount of money and did prove to be correct (DAMN that 13ema is soooooo good). The 3rd attempt was the charm and turned out to be (in my opinion) the 'trade of the day'. The market spend the rest of the European session working its way lower and ultimately gave me a fill at my pre-determined level (+41) two and a half hours later. The sell-off did go much further but considering my combine size (and the fact that I am only trading 1 lots at the moment) I was more than happy with one full BoT success on the day and a net +32.5 tick balance.

I had a meeting at 8AM pst and another at 10AM pst so I ended up missing the panic low and then the ensuing rally. One could argue there was an oversold OTE Long SS trade at/near 93.14 and then another BoT long entry trade at/near 93.50. But as the old saying goes - wait 10 minutes, there will be another bus along shortly....

Sunday, December 30, 2012

CLG13 - Update for the week of December 31st through January 4th, 2013

Welcome back to CRI's ongoing Crude Oil Day Trading Blog.
Price analysis you see (first chart & commentary) is CLG13, for the week of Dec. 24th - 28th, 2012.
Each trading day a 15 minute chart is added and trades for that day are analyzed:

Market Overview: Through the holiday season (especial around the end of the calander year) volumes become very light and price action is very choppy. That pretty much described the past week's price action expect for a brief two hour period (on the open of trade Wednesday, the 26th) where price jumped over $1.50. Now that the better part of the Santa Clause rally is behind us, one must now start to prepare for the pending 'fiscal cliff' and its implications. Interestingly, unlike most other markets, Crude prices have remained relatively strong in the face of pending uncertainly. Is this a clue for us traders going forward, or will CL play catch-up first thing Monday morning and join the rest of the market (heading down).

Weekly highlight: Other than a brief two hour period right after the Christmas break, this past week saw mostly drifting price action as both major institutions and a good many retail participants were simply not at their post's. Considering the seasonal presures (Santa and US Presidential elections), it is not surprising to see prices drift higher. Conversly, as we head into January in earnest, one ought not to be too surprised if we (along with the broader market) have to take a few weeks to pause.

Trading Strategy (1 week): As we get back to 'normal' market conditions I am hoping my regularly established trading plan (ORT's) can be executed. I plan to take all NYPit ORTs this coming week. Because I have one day left on my current combine and it needs to be done by the end of business January 3rd, I plan to practice account trade Monday (Tuesday is a holiday) and trade the combine on Wednesday (January 2nd). Once that combine is completed I will being a new one shortly thereafter and will be trading once again full time in the combine.

Mental State Review: Taking too many loses (regardless of real or practice) is very hard on mental capital. Even though I did all my trades over the past week in my practice account (refer to previous week's comments about holiday trading) I found myself incredibly discouraged as one ORT attempt after another failed. Frankly, I was stunned to see two days in a row go 0/4 on the range trades. I knew before hand that trading was going to be difficult, but 0/4 day after day was debilitating. Having said that, loses are a part of all traders life. I have to learn to accept that sometimes you just are not going to win. This is why the '3 strikes' rule is so important. Daily loss limit must not exceed $465 (3 losing trades at 15 ticks each plus $5 commissions per trade = - $465).

That's all for this post,
Brian Beamish FCSI
The Canadian Rational Investor
the_rational_investor@yahoo.com
http://www.therationalinvestor.ca
http://crisdaytrading.blogspot.ca/ 


$50,000 combine finished today 10 of 10 days +$1,710)
Wednesday's Trade: (2-2 +$200)
Review: After a long pause it was nice to get back to regular trading today. Because of the recent concerns I have had regarding the opening range trade (NYPit ORT) and the 7AM PST trade (7RT) I approached today very cautiously. While my regular rule of moving my stop once +20 has been hit works well during 'normal' market conditions, I have moved that to +10 until I see a consistence to the trade once again. So today (as I have made it a habit) I traded both the NYPit ORT and the 7RT when their respective signals were given. I was able to take 9 ticks on the first trade and 12 ticks on the second. After commissions, that left me with a nice +$200 day. Since this was the last day of my $50k combine (day 10 of 10) I was happy to finish the day on a positive note and two additional profitable trades to add to my performance. Since I met the 'roll over' requirements, I will be continuing on into a new 10 day combine starting tomorrow (Thursday January 3rd.). I finished the combine with a profit of $1710 in 10 trading days. I find this really interesting for two reasons. 
1. I switched from the $30k combine to the $50k combine to be able to handle more risk not to be able to trade more/larger. While the larger $50k combine has a profit objective of $3500, the $30k combine has a profit objective of $1,500 - That literally means if I hadn't made the switch (and done everything exactly the same in the $30k combine as I did in the $50k combine) I would be a 'Live' trader today.....WOW.... So why did I make the switch? The number one reason was that the $50k combine has a maximum daily risk of $1,000 whereas the $30k combine has a maximum risk of $500. This is important because I have found it is the perceived 'risk' that effects one's trading. Whether real or not, the fear of getting figuratively 'killed' makes one both really uncomfortable and rather risk-averse (if you exceed the loss limit you instantly disqualify your combine with no possibility of either going 'Live' or even getting a refund/rollover). I found that with the $50k combine (and the $1000 risk level) I didn't even think about hitting my loss limit (because there was no way I could lose 100 ticks in one day) and it didn't effect my trade decisions in the least. I am concerned that with me enrolling back in the $30k combine ($500 max risk) that my focus will be pulled away from making good trade decisions due to risk aversion. I went through this very thing for several months and it should be interesting to see if it happens again. Interestingly, my maximum draw-down through this past combine was $150 on any given day so if I do exactly the same thing through this next 10 day trading period there is no reason why I can't hit the $30k combine performance requirements to be able to go 'LIVE'. 
Just do it Brian!
2. The second thing that jumps out at me is really more from a broader perspective. As a long time registered broker (of which I am not currently) I would have commended any client of mine with a 10 day track record like my past combines'. Frankly, $1710 in profits trading a 1 lot Crude Oil contract (margin of $7,500) with a stated maximum daily draw-down of $465 [3 strikes (15 tick stop) and you are out] and an actual maximum drawdown of $150 is fantastic! These performance numbers are startling to say the least (it boggles the mind when one anualizes these kinds of compounded returns!). If I can acquire a skill set (through this one year plus TsT experience) that enables me to trade my personal account to only half this kind of profitability, I will be better off for it - funded through TsT or not. For the record, I am not really quite sure where TsT comes up with their $30,000, $50,000,$150,000 etc combine numbers because they do not jib with either exchange stated margin requirements (at worst $10,000 margin on a single CL contract) or what I would personally consider acceptable risk per trade. Based on the simple 1/20th or 5% risk principle, if I were indeed working with $30,000 in capital, I would be more than happy risking $1,500 if I knew there was a better than 66% chance of turning that into $3,000.  Here is where I have a fundamental difference with TsT. It shall be interesting to see if running my '3 strikes and you are out' ($465 max daily risk) model can work within the confines of the $30,000 account TsT model (and more importantly the death line - max daily risk of $500.00).

Thursday's Trade (2-2 +$160)
Review: Today was the first day in my new $30k combine. The major concern of mine through this combine is the daily $500 max risk loss limit (as mentioned at length previously). With the above in mind, and my resolve to take each and every time frame range trade, I approached today's trade with a bit more caution than usual. Indeed, I did take both the NYPit ORT 1st leg and the 7RT 1st leg. As per my recent posts regarding the illiquid nature of the RTs lately, I moved my stop up once +10 was hit on both trades. Indeed, neither of the time frame trades moved fluidly - so I got out on the first sign of weakness. The NYPit ORT gave me 9 ticks of profit and the 7RT gave me 8. Net production for the two trades came to +$160. Since I need to average $150/day in production to meet the $30k combine profit objectives I was happy to basically call it a day after the 7RT. I took the attitude that I would do another trade IF an incrediblly juicy setup came along. I didn't really see anything that jumped out at me through the rest of the day so finished with 2 trades on the books and a net production of $160 on the day. All in all, I felt very good about today and the direction my 'hot-dog stance' business is headed.

Sunday, December 23, 2012

CLG13 - Update for the week of December 24th through December 28th, 2012

Welcome back to CRI's ongoing Crude Oil Day Trading Blog.
Price analysis you see (first chart & commentary) is CLG13, for the week of Dec. 14th - 21st, 2012. 

Each trading day a 15 minute chart is added and trades for that day are analyzed:
Market Overview: In polar opposite to the previous week's price action, this past week saw Crude oil prices generally work their way higher. The previously noted $87.50 was breached early in Sunday evening's session and price continued to grind higher into the trading range breakout target ($90.65) area. Following that, price quickly retraced 50% of the up move through late Thursday and into Friday (testing the $88.20 breakout level again) and then finished the week on an bounce. With little new news regarding the pending 'fiscal cliff' it is not surprising to see the market basically move sideways until we some sort of resolution. Having said that, it is interesting to see price registered a weekly (continuous contract) double bottom with the move through $90.33. Considering too the overly bullish stance of Institutions - one ought to expect a bit of bullishness. How much of a 'bit' is the 64k question at the moment.

Weekly highlight: Considering the holiday atmosphere, it was not surprising to see many of the regular 'order flow' setups did not work. Opening range trades went for a fraction of the distance they usually do. The action itself seemed very suspicious too in that it was only through the range trade time frames (for me in particular the NYPit ORT 6AM pst & the 7RT 7AM pst) we saw violent doji candles. In essence, pit traders would run the market one way (to trip buy/sell on stop orders) and then instantly run the market the other way about 20 ticks to try and flush out the weak hands. It worked on me and as a result I started each trading day this week with losses - very frustrating.


Trading Strategy (1 week): Same as previous week...Because of the holiday atmosphere, I expect market participation to wane and price action to get very choppy. If I had my druthers, I would simply take the period from December 15th to January 1st off. Nonetheless, I will be at my post and making notations of trade setups through this year's holiday season. I just won't be surprised to see performance of normally predictable setups not work as well. My theme of late is simply to continue doing more of what works and less of what doesn't. The time range trades seem to work well with the type of trader I am. To that end my goal for this coming week is to have a notation for both the NY Pit ORT and the 7RT trades every day. I will be doing them through the practice account as I don't want to start a new combine until the new year.

Mental State Review: I feel very positive about trading and look forward to a long and substantive career trading commodity futures. It took me several months to get 'up-to-speed' and to really figure out my 'edge'. At this point I have a very consistent daily trading plan with specific trade setups to watch for. Additionally, I have moved to just trading off the 15m chart (with referral to the 1hr/4hr/Daily charts
for levels). I find that if I concentrate on just one time frame I can identify the setup and don't get excited about the trade (while watching the 5m chart I found I would get excited/nervous about what it was telling me and would end up exiting trades far too early). Friday's substantial hold (bought at $88.39) was a trade I really liked doing. There was a clean 15m trade-able BoT bottom and I went for it. The market at no point registered a 15m sell so I just held on to the position. As you can see (please see last week's blog entry for Friday's 15m chart), that analysis was correct and the one trade made up for 4 failed ORT trades from earlier in the day.


That's all for this post,
Brian Beamish FCSI
The Canadian Rational Investor
the_rational_investor@yahoo.com
http://www.therationalinvestor.ca
http://crisdaytrading.blogspot.ca/ 

Sunday, December 16, 2012

CLF13 - Update for the week of December 14th through December 21th, 2012

Welcome back to CRI's ongoing Crude Oil Day Trading Blog.
We are into roll week so we are switching from Jan. to Feb.
Price analysis you see is CLG13, for the week of Dec. 14th - 21st, 2012. 

Each trading day a 15 minute chart is added and trades for that day are analyzed:
Market Overview: This past week and a half saw yet another attempt to push price through the $85.00 support level and fail. In the short term we have both holiday and US political seasonalities holding price up and over the medium term we have typical annual seasonalities supporting price. Put it all together and one finds it hard to believe prices want to go much further down from current levels - once into January, those bets will be off.

Weekly highlight: This past week spent most of its time cleaning up the meltdown of the previous. Inventories continue to run at rather large rates and (based on CoT data) major players are unwinding serious positions into the year end. Having said that, price didn't fall much and indeed currently we appear to be pointed back up in the near term. We spent the later part of the week slowly working our way back up to the intra-week 50% level (88.33) and I would expect this coming week to start off in the same fashion. If and when you find a market that can not go down on bad news (in this case huge inventory builds) then one ought to prepare for higher not lower prices. Considering too the seasonality of the market and I would be surprised to see sellers gain too much traction until the new year. But one also ought to remember too, these low volume sessions can lead to violent short term price corrections. Late buyers will be punished so time your entries carefully.


Trading Strategy (1 week): Because of the holiday atmosphere, I expect market participation to wane and price action to get very choppy. If I had my druthers, I would simply take the period from December 15th to January 1st off. Nonetheless, I will be at my post and making notations of trade setups through this year's holiday season. I just won't be surprised to see performance of normally predictable setups not work as well. My theme of late is simply to continue doing more of what works and less of what doesn't. The time range trades seem to work well with the type of trader I am. To that end my goal for this coming week is to have a notation for both the NY Pit ORT and the 7RT trades every day. I will be doing them through the practice account as I don't want to start a new combine until the new year.

Mental State Review: Since adding my daily activity and reviewing my trades in earnest through this blog my mental state has improved dramatically. From shooting from-the-hip to an honest to goodness business model (my 'hotdog stand') I feel as though my future as a professional futures trader is crystallizing. Now that I have found something that works, the key is to consistently do the same thing day in and day out - I have a feeling I am going to get rather sick of ORT's (teehee)...

Above is a detailed listing of my trading for the past week. It reads very well (except for Thursday!). I like the consistency of my trading of late and am proud that the hard work I have put into both building discipline and working within specific time/trade frameworks is paying off. It is interesting too to see how 'old habits' on Thursday led to mistakes and poor trade location decisions - more of what works Brian, less of what doesn't.

That's all for this post,
Brian Beamish FCSI
The Canadian Rational Investor
the_rational_investor@yahoo.com
http://www.therationalinvestor.ca
http://crisdaytrading.blogspot.ca/  


p.s.
The five common trading mistakes I make which lead to trade failure:

1. Not doing full daily setup routine BEFORE the first trade of the day - It take about 30-60 minutes; do your homework.
2. Not respecting 15 minute momentum & volume patterns - listen to the market, don't fight it (BoT's).
3. Not professionally entering the market - Use ema checks NOT breakouts to enter position (BoT's).
3. Not waiting patiently for alignment -  4hr/1hr OTE SS; 15m momentum & volume divergence; 5m POTE (OTE's).
4. Not holding trade to fruition - calculate realistic reward:risk targets and let the model work. If trade fails - what next plan?
5. Not respecting daily personal loss limit - three strikes and you are out!
 
p.p.s.
Trades I Do

Breakout Trade (BoT's: Price with Momentum & Volume): Watch and respect 30 minute, 1 hour, 4 hour & daily momentum & always wait patiently for 15m momentum divergence/confirmation. If 15m momentum signal given then watch 5m for vol/mom signals. Use ema checks (Holy Grail for example) at 5m trendline to enter positions NOT Breakouts.

Range Trade (OTE: Optimal Trade Entry based on test of resistance/support levels): Primary tool for determining trade location is a 70.5% counter trend retracement based on 1hr to 4hr chart price ranges. Once in zones, use momentum & volume divergence on 15m to signal trade alignment. Once aligned calculate OTE entry & POTE (stop at least 11 ticks above previous peak/trough). Enter order on an open order basis. AOCO (-.21/+.41) at level. DO NOT alter – let run to fruition.

Extreme Range Trade (ERT: Based on the Swing Pivot Touch theory): Based on the principle that initial tests of significant swing levels often meet resistance. Look to identify key hourly swing points at or near 4 hour / Daily OTE levels. Follow same plan as OTE trades but enter order to take position at key high/low not OTE or POTE level.

Opening Range Trade (ORT: Based on pent up demand from overnight trade into NYPit open): Watch 5:55AM, 5 minute price bar highs and lows. Place open orders at 6:00.01 two ticks above (buy on stop) and below (sell on stop) the 5:55 bar's range (AOCO -.15/+.41). Once filled on one side cancel other order if less than 15 ticks away from fill price.  If trade reverses and stop is hit, look to take fail side of the trade - 2nd leg. (AOCO -.15/+.41). If the second leg open order was not cancelled let price action carry you in. If the second leg open order was cancelled, re-enter it as soon as first leg is stopped out. Maximum risk on trade is $310. Leave trade on, trailing stops every 20 tick increments. 


7AM Range Trade (7RT: Based on either confirmation or exhaustion of the NY Cash market open): Similarly to the ORT, watch the 6:55AM, 5 minute price bar high and low. Place open orders at 7:00.01 two ticks above (buy on stop) and below (sell on stop) that bar's range (AOCO -15/+41). Once filled on one side cancel other order if less than 15 ticks away from fill price.  If trade reverses and stop is hit, look to take fail side of the trade - 2nd leg. (AOCO -.15/+.41). If the second leg open order was not cancelled let price action carry you in. If the second leg open order was cancelled, re-enter it as soon as first leg is stopped out (and hope you don't miss the trade). Maximum risk on trade is $310. Leave trade on, trailing stops every 20 tick increments. 

happy trading all...


Monday's Trade (0-0 $0 practice account trades only)
Review: Since TsT's combines run for 20 business days and a candidate is required to trade at least 10 of them I decided to trade 9 days straight up front and plan to not trade the combine again until the end of December to avoid the holiday season confusion. Currently I have 1 day left to complete and I have 9 trading days to do it. To that end, for the next 8 trading sessions, all trades will be done in the practice account. So with that said, today's trading (8-8) felt far too much but because it was the practice account, I didn't have the strict restrictions to taking a position. As you will notice, by time trade 6 rolled around, I was getting sloppy and a bit complacent.  

On to the trade. After doing my weekend homework, I felt there was a high probability we were going to $88.33 and the break of $87.48 early Sunday evening solidified that thought. The question was, how/where to get in to be able to handle pullbacks. While waiting for the answer my first trade of the week came in when prices moved back to the 20ema and failed (with ADX>30 this represented a Holy Grail trade). That trade was a good start for the week and I covered it at the corresponding 5m OTE long ss for a quick profit. Following that short trade the answer to my original question came. Shortly thereafter the market registered a tight 15 minute double bottom (with corresponding bullish momentum divergence) and a long trade (BoT) was setup and ready to go. My second trade of the day was to buy that bottom and sure enough the market took off soon after. After that rally, the NYPit ORT was actually short and again I executed well and was able to take some more of the market's money away from it. That fail pattern quickly dissolved and I was swept back into the market on the long side when prices broke the NYPit ORT high of $87.52. Finally, the 7RT trade setup up bullish and I was taken long again at $87.94. This last trade was pushing it and while I was able to liquidate at higher prices ($88.07) it was clear this market was running out of steam. Additionally, we were getting close to the $88.33 area so upside potential would be limited above $88.00. At this point I was 6-6 for +$825 - and basically on fire! That was the end of the 7RT trade and I should have called it a day at that point. I spent the rest of the day kinda bored and took three more trades. Two of which I couldn't figure out why I did them (and it cost me $310) and the last was a scratch. I finished the day 8-8 for +$495. A good day, but not nearly as profitable as could have been.

Tuesday's Trade (0-0 $0 - practice account trades only):
Review: Today was an excercise in ugly trading. One simple rule I have (and think I will start applying to the time range trades) is never take a position that is not 'alligned' with momentum and volume. This is a strict rule for BoT trades and I have noticed that many of the Time Frame trades that occur in poor trade location (ie at a keltband) often fail. Additionally, because it is a holiday session, the range trades just simply do not have the participation they usually do. Many regular market participants are not trading and as a result, moves that usually translate into 20 cent swings are at best moving 10 ticks. Interestingly, if I had stuck with the simple original trading plan (taking all range trades to fruition) the ORT trades would have been 3 losers (for a total of $465 of loses) and 1 winner (for a total of $405) and I would have finished the day down $60 (big deal). Instead, by time the fourth RT trade came along I was underwater considerably and it effected my trade. I ended up dumping the one good position I had all day - go figure. To add insult to injury, after that exit I put on two (total non-alignment) trades that were basically doomed to fail - and they did. So what can I take from today?
1. If you are going to do ORT trades then you must do all legs and hold to fruition (no ifs ands or butts)
2. If you are down through the 2nd leg of 7RT you are probably best to just call it a day. If you are up then use half of profits as 'give back'. Should you give that half back then call it a day.
3. If you are going to trade in holiday sessions, be light on your toes and don't expect to see violent swings. If the market is at Keltband - don't hesitate to get out!
That's all for today's trade. It is interesting to see how loosy-goosy my trading is in the practice account. A goal of mine going forward will be to try and only take BoT's/OTEs etc WITH alignment....if it isn't there do not take trade!     

Wednesday's Trade (0-0 $0 - practice account trades only):
Review: Today was a sloppy day for me. I was up late playing the LKZ (and ended up with a $45 loss to start my North American session), slept in till about 10 minutes before the NYPit ORT and didn't do any of my pre-market setup work. These three variations in my normal protocol wouldn't be tolerated in my combine trading and I find I am far too relaxed (non-professional) while trading in the practice account. Couple the fact that I am simply not trading my Combine account through the holidays and I believe my subconscious has kinda just shut off. 
On to the trade. While I did finish the day positive, it was by no means a walk in the park. I must admit, since I have moved from -21 on my stops to -15, handling a bunch of losing trades isn't that bad (especially when you can book a +51 and +25). Regardless, I spend far too long today playing catchup rather than offense. As I kind of expected, the NYPit ORT was horrible today (due to lack of participation) and resulted in two quick stop outs. The market then went on to fail through the NYPit ORT again and so I went short. I rode that third trade right into the Weekly DOE inventory report (was doing well) and then got smashed. While the numbers themselves were not startling, the event gave the market the needed boost and she simply took off. Again, I miss-managed a trade and let myself get stopped out at a .31 loss. Luckily, I went long on a break of the inventory peak (.92) and that trade simply rocked. Adding to my mistakes today, I got anxious and sold the .93 long even though there was little reason to do so. As a result, I literally left $500 in profits on the table (ugh!). The rest of the day was spend milling around trying to get the account back to 'scratch'. Through several quick OTE/BoT trades I was able to finish the day (13-13) [wow, way too many trades!] and up $75.00 net. I commented in chat that I thought the virtual sim broker did almost as well as I did today ($65 in commissions!).

Less of what doesn't work and more of what does....ORTs clearly have trouble in low volume/holiday markets....

Thursday's Trade (0-0 $0 - practice account trades only):
Review: Another sloppy day Brian. I have been focusing my attention on the LKZ (London Kill Zone) of late. This has caused me to be up and active in the evening (Vancouver time) and into the wee hours of the morning. I don't think this approach is productive given my current attention on both the NY Pit ORT and the 7RT. This recent activity has caused disruptions in my sleep and as a result, have been caught sleeping in on more than one occasion. This simply cannot happen to be successful, as my actual trading through this experience can attest to. So with this in mind, no more trades prior to 5:30AM local time and for heavens sake Brian, get to bed! I want to get back onto a regular routine and try and stop this sloppy trading. Thankfully it seems to have come at the same time as I have switched to practice account trading, so its not the end of the world.
So, looking at today's trade one can see that I did screw up royally. It was only through the good graces of an open ended risk position (within the practice account) I was able to hold on to an absolutely horrible short through the evening. I added to the loser (on an AOCO basis) and took a $155 hit on the way up. I still can't quite figure out why I thought that attempt was 'good trade location') My last attempt at adding to the horrible initial trade was I placed an open order to sell 1 more at the level I should have shorted (the OTE principle) and sure enough it was filled. At one point this 2 lot trade was down more than $700 but then abruptly turned and went positive. The end result of the trade was a net +.24 ticks but the open ended risk at one point was over $600 - simply not realistic in regular trading. While technically not a 'fail' (I did end the day with a positive balance) I consider today a very poor showing. Lots of bad habits that I am going to stop...I am going to leave it at that.

 Friday's Trade (0-0 $0 - practice account trades only):
Review: Futures trading ain't easy! One little mistake and your hole day can be in shambles. That seems to be the theme of today as I spent most of the trading session trying to make back the ground lost on poor ORT trade execution. As suggested yesterday, I discontinued watching the market through the evening and took a far more earnest approach to L&B's business. I woke this morning at about 5AM to see the fallout from the failed 'Plan B' vote attempt by the Republican's in the US House (and the associated drop in the stock market). I did my analysis and prepared myself for the NYPit ORT. I did go short on the 1st leg of the trade on the fail through 88.10. The trade did go +20 ticks but it didn't stay there long. The market hadn't stabilized enough where I could realistically put in my +20 stop and so when it subsequently rallied through the NYPit ORT top (88.19) I was flushed out. Since the stop on the short entry ( 88.25) was higher than the original BonSt order at 88.21; once I was stopped out of the 1st leg, I put the 2nd leg order back in at 88.21 and was filled shortly thereafter. The market then waivered for a bit and finnally broke back down in earnest stopping the 2nd leg (long) of the NY Pit ORT out at -15 (0 for 2 for the NYPit ORT today). I then watched price tank over the next hour (which pissed me off to no end) on the heels of a perfectly good BoT sell signal working from the break of 88.90. I went even as far at to call it the Trade of the day and I missed it playing the pit opening range trade mess.  The initial reaction of the NYPit ORT was down and it was probably right. But the AOCO on-stop orders just got eaten alive in both directions shortly thereafter.  I have felt over the past holiday 'thin' sessions that the ORT was suspect. Pit traders seems to know about it and push prices to +/- 20 against the signal to see if they can stop weak handed players out. Through this week I have only seen 1 ORT trade go the entire +41 expectation with almost every day an ORT leg failing on both the Pit open and the 7RT. It shall be interesting to see if the ORT comes back to its statistical 'norm' once the holiday season is behind us. As you can see, the 7RT didn't treat me much better. Both legs were stopped out in what seemed to be a very well orchestrated move. Again, very suspect given the thin volumes. Regardless, shortly after 7:30AM today I was down more than $620 and ready to call it quits for the day. I decided I would do one more 'non-ORT' trade and see if maybe it was just a strategy issue. Indeed, simply using BoT's and OTE entry assisted BoT's, I was able to grind my way back to basically break even on the day ($-65). The only reason why I exited my final long (which I must admit was a really really good trade Brian!) was because I was having lunch with my son at 12:30pm pst and couldn't stay the remaining half hour of trade. In fact, the position ran another 15 ticks further so there was plenty of room for that one trade to take me back to positive for the day.
So other than the fact that ORT's got blown up this week on almost every occation (which led to substantial losses to start the trading days) today ended relatively positively. Given the markets are only open for a few hours Monday, Tuesday is Christmas and Wednesday is Boxing day (all holiday'ish) I don't really plan to look a the market much until Wednesday or Thursday of the coming week. Furthermore, I don't plan to do any combine trading until into the following week. 

This is my last post here until the New Year, so Merry Christmas all, Happy New Year and lets all rock 2013!!!!

Brian

Sunday, December 9, 2012

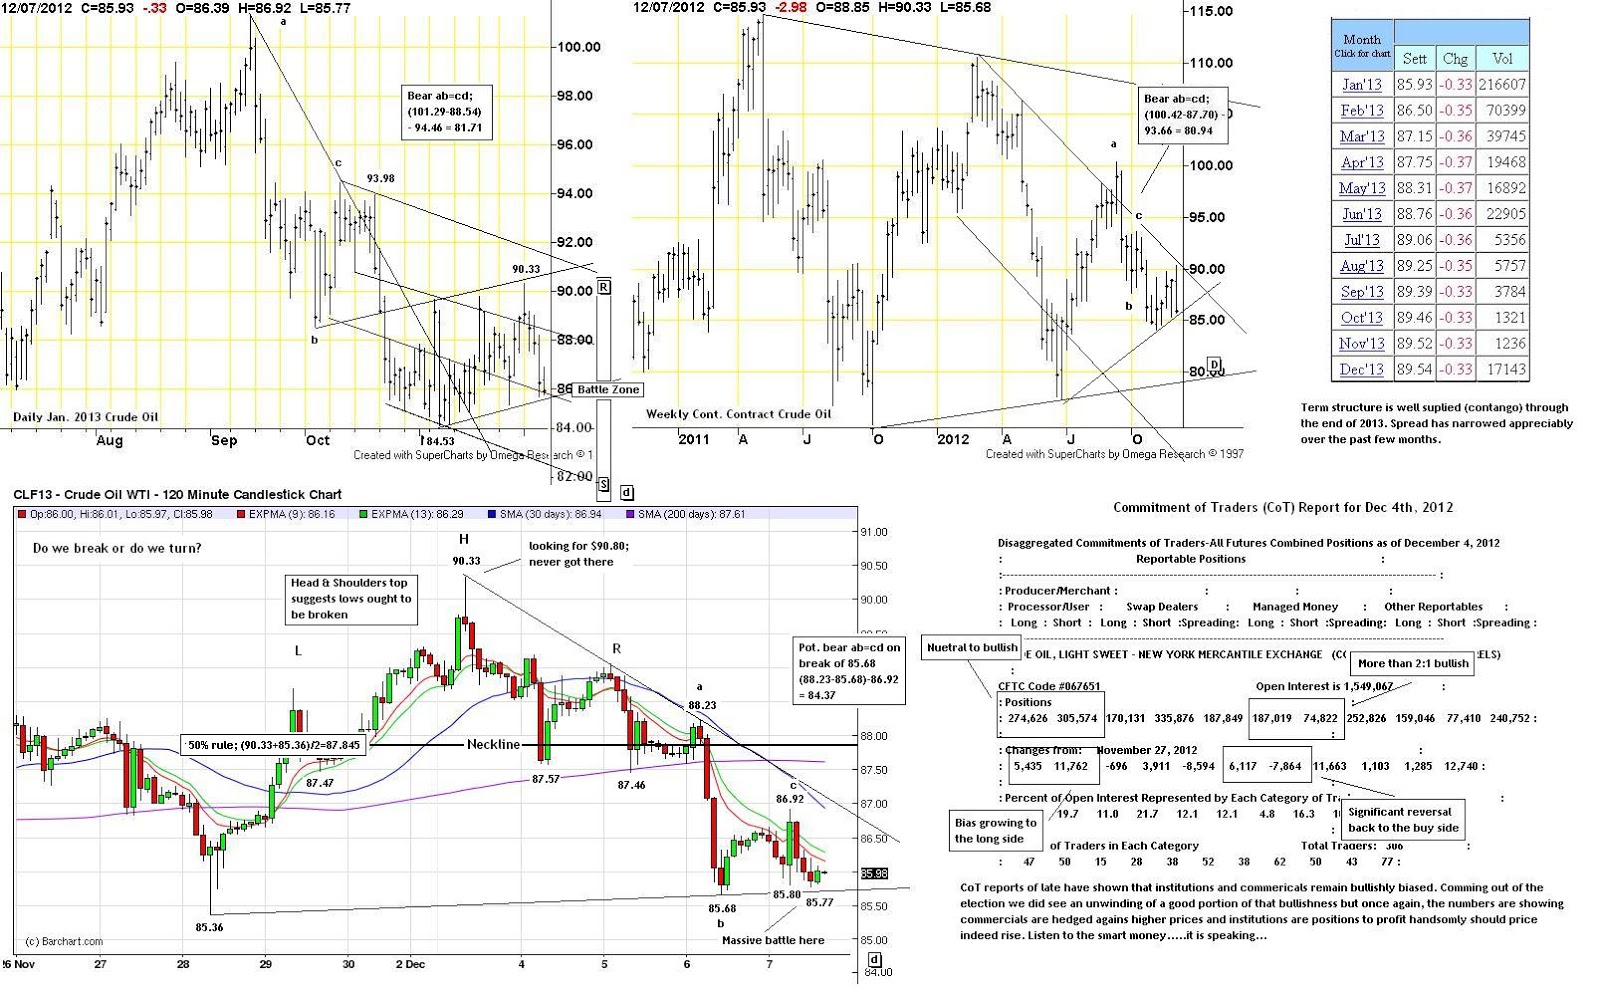
CLF13 - Update for the week of December 7th through December 14th, 2012

Welcome back to CRI's ongoing Crude Oil Day Trading Blog.
Price analysis you see is CLF13, for the week of December 7th, 2012. Each trading day a 15 minute chart is added and trades for that day are analyzed:

Market Overview:  The aftershocks of hurricane Sandy continue to reverberate throughout the North American economy (in this case dramatic inventory builds in refined energy products). Couple this shock with political gridlock ahead of the fiscal cliff and we have the makings of a temporary vacuum in the supply/demand equation. Buyers are reluctant to take risk while suppliers are flooded with product - a very interesting scenario indeed. Technically, price has been pointing lower for some time now, is it into the fiscal cliff event we see our ultimate lows?

Weekly highlight: The bullish enthusiasm seem coming into the week was quickly dashed. Late Sunday evening and into early Monday morning prices reached for our $90.80 target, only to fall short (topping at $90.33). From there is was a consolidation into Wednesday's inventory number. That release showed a dramatic build in refined products and a preception of far weaker demand than what was previously though. Is this a temporary weather related disruption or something more perminant, only time will tell. Regardless, that bearish fundamental news broke tenuous support and suggested last week's lows ought to be tested in earnest. That test is currently underway and at the moment, It is too early to declare a victor. Should the bulls loose, daily and weekly bearish ab=cd targets point to the $84 area and then the low $80 area as our next significant areas of support.


Trading Strategy (1 week): As outlined on the 2 hour chart, I shall start the week awaiting the resolution of the current battle. If the bottom is broken (and a subsequent failed test of the underside of these lows is established) I shall be looking into the low to mid $80's for price targets (as outlined on the charts above). Should these lows hold (with a momentum/volume bottom) I shall be looking for a test of the 2 hour 50% level followed by a rally into the entire range's OTE Short SS (70.5% retrace) which currently is at $88.95. Finally, should the rally be strong enough, I shall look for a test (and possible break) of last week's highs just above $90.33. I would be rather surprised if price can get much higher than those levels. Should that occur, a new review of the charts would be needed.
Mental State Review: This past week was another small breakthrough for me on this long journey to becoming a successful day-trader. I had stated in last week's blog that my number 1 goal for the week was the take the NY Pit ORT every day (both legs if needed) and I did exactly that. Additionally, I really wanted to make the effort to post a 15m chart every day with both entries and exits as well as notes. I accomplished both goals and am both proud of myself for doing what I planned and a little shocked at the results. This was by far my most productive/profitable (relative to risk) trading week with TsT. As outlined on each day's chart, my entries and exits were well planned (followed trading plan to the letter) and I was rewarded with profits every day. I even commented in TsT's Lounge at the end of the week 'I think I have found my perfect little hotdog stand business'. Here then is last week's activity:
While no one should expect to be profitable every day, this is pretty much exactly how I would like to build a solid foundation for my trading business. Indeed, the ORT itself was only fully successful 3 of the 5 trading days but with a combination of the model and my 20 plus years trading experience I like how the trade feels. By forcing myself to take the NY Pit ORT, I am both active and focused at the start of every day. Additionally, the incremental income provides both a mental and financial cushion so that I can go stalk bigger trades through the rest of the day. If and when they come, I am in a far better position to do something. I am reminded of an old client's adage: 'always play from a position of strength, my boy'. Additionally, my rule of moving my stop to +20 ticks is a stop and not a market order. I do fully expect to one day in the not too distant future find that my stop doesn't get hit and I am carried along for a much bigger ride. 

To that end, my goals for the coming week are to continue to trade every day's NY Pit ORT (both legs if needed) and be content should it be a bust (-$320). It is interesting to see in the above spreadsheet the column marked 'tinker risk'. It seems that my tinkering cost me about $400 through the trading week. I wouldn't have been nearly as accurate (as one day I would have been stopped out at a $150 loss vs the $65 gain I booked) but the AOCO sell orders would have been hit on three separate days (all over 20 ticks greater profit then where I got out). This has been a historical problem for me. Given my +20 tick rule I am not so upset since I am following a rule I wrote. I will work on being less hasty with my exits. The cushion I have built so far makes me far more comfortable with that notion going forward.

As well, I have a goal this week to mark on the 15m chart I post where I believe the 'trade of the day' occurred. I have found that about once per day the charts seem to line up with price/momentum/volume all pointing on one direction or another. Most times these days I seems to come in through the European session, but Friday for example I believe it came in about an hour or so before the US NFPR report. Once that rally was done, so was the day. Anyway, it should be an interesting experiment going forward.

That's all for this post,
Brian Beamish FCSI
The Canadian Rational Investor
the_rational_investor@yahoo.com
http://www.therationalinvestor.ca
http://crisdaytrading.blogspot.ca/ 


Breakout Trade (BOT's: Price with Momentum & Volume)
Watch and respect 30 minute, 1 hour, 4 hour & daily momentum & always wait patiently for 15m momentum divergence/confirmation. If 15m momentum signal given then watch 5m for vol/mom signals. Use ema checks (Holy Grail for example) at 5m trendline to enter positions NOT Breakouts.

Range Trade (OTE: Optimal Trade Entry based on test of resistance/support levels)
Primary tool for determining trade location is a 70.5% counter trend retracement based on 1hr to 4hr chart price ranges.
Once in zones, use momentum & volume divergence on 15m to signal trade alignment.
Once aligned calculate OTE entry & POTE (stop at least 11 ticks above previous peak/trough). Enter order on an open order basis. AOCO (-.21/+.41) at level. DO NOT alter – let run to fruition.

Extreme Range Trade (ERT: Based on the Swing Pivot Touch theory)
Based on the principle that initial tests of significant swing levels often meet resistance. Look to identify key hourly swing points at or near 4 hour / Daily OTE levels. Follow same plan as OTE trades but enter order to take position at key high/low not OTE or POTE level.

Opening Range Trade (ORT: Based on pent up demand from overnight trade into NYPit open)
Watch 5:55AM price bar highs and lows. Place open orders at 6:00.01 two ticks above (buy on stop) and below (sell on stop) the 5:55 bar's range (AOCO -.15/+.41). Once filled on one side cancel other order. If trade reverses and stop is hit, look to take fail side of the trade. (AOCO -.15/+.41). Maximum risk on trade is $310. Leave trade on, trailing stops every 20 tick increments.

Monday's Trade (1-1 +$175):
As is often the case, it was tough to drag myself out of bed for 4:30 this morning. Indeed, I didn't really get going until well after 5 and as a result missed some good practice time ahead of the NY Pit ORT. Regardless, I had done my analysis by time 6AM rolled around and felt like I was in a good position to participate in the ORT. It came with a break of 86.58 and we were off and running. My rule of putting in a stop at +20 ticks works wonderfully at ensuring a quick exit at a healthy reward. I was filled within 5 minutes of the open when prices probed the high 86.30's and was ultimately flushed out of the short trade when my stop was filled at 86.39. Sometimes stop orders get what is known as slippage and my +20 order was subject to -2 in slippage which gave me a fill at +18. Considering it was early on a Monday morning, I wasn't going to complain. Once again, the NY Pit ORT was profitable and I was content to sit on the sidelines with 17.5 ticks of the market's money. As the trade wore on, two things became clear: 
1. I cost myself 23 ticks today in what I call tampering risk. The market did eventually go to my AOC +41 level before stopping the trade out. 
2. The Trade of the day came on a counter trend rally (into a well define OTE level) at 86.54. That trade alone would have been good for 40 ticks if not a lot more. 

A goal of mine this week is to try and identify the 'Trade of the day'. I believe the market sets up at least one healthy move per day, it is just a question of finding it. For the time being, I don't mind missing the trade, the important thing is to identify it and learn/memorize the setup. My hope is that If, in the future, I happen to see the same situation I can act more from memory than on blind faith.

Tuesday's Trade (0-0 $0):
Review: Today I broke a big rule of mine and that is to be up and ready to go to do the NY Pit ORT. I slept in and missed the entire setup. Ironically enough, that ORT was a fail today so it turns out I didn't miss much. But because I broke a cardinal rule of mine, I chose not to trade in the combine for the entire day. The trades I did take (3 in total) where all done in the practice account. They were all BoT's and I am coming to see the value in waiting for the breakdown, then waiting for the 9ema check on the 15m chart and then considering the trade. While I was stopped out on one attempt at this strategy (for -15 ticks) the other two fills (at +41 each) more than offset any pain felt on the loser. The day did prove to be very profitable but alas trades in the practice account don't really count. Good practice but that is about it. I have marked my entries and exits on the chart above but as you see I posted Combine trades (0-0) for $0. As was my goal for this week, I have also marked where I believe the Trade of the day occurred. I believe it came in on a test of the 1 hour OTE Short SS at 86.23. That 15m candle ended as a 'shooting star' (a rather bearish candle in itself) and was coupled with both an overbought breakdown (W%R) and a bear momentum divergence (MACD). Additionally, the break saw an acceleration in volume which only confirmed that the bears where in control and price was going to go down.

Wednesday's Trade (1-1 +$405):
Review: Today I was up and ready to go nice and early. However, the market itself was anything but cooperative. As you can see, as the early morning (late European) session moved into the NY Pit open it honestly looked to me like the entire market was about to break in earnest. Momentum indicators were all topped out and volume was abysmal. Heading into the NY Pit ORT trade I was prepared to go either way since I had done all my homework. Indeed the NY Pit ORT was a very pivotal moment in the market this AM. As price opened up I was filled on an initial burst higher in buying (break through the 5:55 bar high at 86.29) at 86.31. The market wavered for a moment and then launched higher. I marked this as the Trade of the Day because there was a tight setup, the market coiled and then broke against the setup for a violent run. Sometimes commodities don't give you much to work with and today was such an example. The 5:55 bar low (86.17) proved to be an interesting pivot later in the day but for the time being it was the launch pad and price never looked back. It was a big goal of mine this past week NOT TO TINKER. So to that end I sat nervously as the market decided if the NY Pit ORT was going to be long or not. Indeed, long was correct as price pushed violently higher and I was flushed out of the market at my AOCO level (+41). Considering the significant fundamental news coming down the pike through the rest of the day, I was more than happy to sit on my 41 ticks of the market's money and watch. The day did prove to be rather wild. I did see an interesting short opportunity on the 7AM range trade (basically the same as the NY Pit ORT but using the 6:55 bar range to determine entry levels). I took the short in the practice account and did well on the trade but covered it as we drew near to DOE inventory numbers. Those numbers were bearish and price fell further after that. I wasn't upset as this trade confirmed my correct interpretation on the market and the only reason why I exited early was to error on the side of caution rather than blind trading aggression. All in all, a very productive and positive day.

Thursday's Trade (5-5 +$45):
Review: Oh boy, here we go again....I could literally feel myself slipping backwards today. I wondered later if just the thought that I was getting close to my current combine objectives (well at least as close as I have ever been before) made me regress. Regardless, I started the day on a bad note and didn't look back. I woke literally a minute before the NYPit ORT, didn't do any of my pre-market setup and was still half asleep. For some stupid reason I thought I could just trade through such a blunder. Thankfully, the trading gods (jojo....wink wink) allowed me to recognize the old bad habits within a few minutes of my regression and I simply put a stop to my trading day. Its funny how when you get on a bad streak it is so easy to get swept up in it. Yet when you simply stop and come back a few hours later and review it seems so easy to recognize in hindsight. When doing my trading review chart above it was so obvious how detrimental my 'unforced errors' were. Regardless of strategy (and its expected statistical outcome) if you don't have sound principles (ie. don't make dumb trading errors)  you are toast - and today was a perfect example. Looking back in hindsight, I see that the ORT would have been good for 35 ticsk (and I would expect myself to have moved my stop to +20 on the triple top fail at +35) so I missed a good trade. Additionally, there were a couple good washed out trade points through the day too. I don't know if I would have had the confidence to trade them in particular but the important lesson I am taking away from today is that I was ill prepared and almost got eaten up with my mistakes. Luckily, I was able to exit the day with a small gain, but ironically, all these small gains and losses (5-5 for +$45 is nothing to be proud of) actually hurts my overall statistics and makes it less likely for me to go 'live'. 

So for tomorrow - get up early, do your homework, follow the plan and don't tinker.....lets nip this thing in the bud!

Friday's Trade (1-1 +$205):
Well today was indeed a study in contrasts to yesterday. Thankfully, I took my blog post's words to heart and got myself back on track this AM. I was up nice and early and did my homework as planned. Interestingly (as I have commented previously) the market was at or near the bottom of its trading range heading into the NY Pit ORT this AM. As the chart above illustrates, prices broke in earnest through the mid European session and by time the North American session rolled around we were sitting on or near the lows. I took the NY Pit ORT (as has been the plan all week) and watched it work for a bit. My cardinal +20 stop rule helped today as prices tried to probe the $86.00 level only to be rejected rather soundly. Today I put the +20 stop in on the second attempt to break the $86.00 lows and when the market reversed I was flushed out. I am happy with the trade decision as prices tried to push lower twice and just couldn't. Indeed, that push lower came into the NY Cash market open (USO actually gaped higher on the open) and it was clear they just didn't want to take stocks lower at that time. I was happy to finish my combine day with one solidly profitable trade and leave it at that.
As an experiment, I have been trading the 7AM Range Trade (7RT) very much in the same way I trade the NYPit ORT. The cash market often gaps higher/lower then within the first half hour reverses that initial push and settles into a range. Just as the 5:55 (pst) 5 minute bar's action gives you specific marks to work with, the 7RT follows the same frame work. So with that said, my goal for the remaining 2 weeks of this trading year is to take the 7RT trade in addition to the NYPit ORT. I plan to make notations and references to it on my charts but will contain the 7RT to Practice account trading only until I am comfortable with it. So with all this in mind, we see from the chart above that the 7RT turned out to be one hell of a trade today. The initial signal was to go short (and I did so) when the 6:55, 5m bar's lows were broken. That short was stopped out at a 13 tick loss. The second leg of the 7RT came in right away and that long performed rather well. The 'buy' came in at 86.34 and the market didn't look back until my +41 tick AOCO sell order was filled. So for the record, 7RT was (2-2 for +$280).