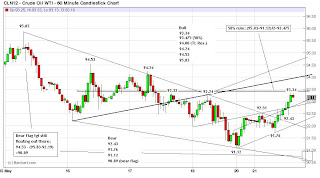
Price analysis for the week of May 18th, 2012:
It is roll week so we are going to move to July contract
(as of Monday May 21, 2012)
(as of Wednesday May 23, 2012 5:30AM PST)
(as of Thursday May 24, 2012 10:30PM PST)
Market
Overview: In a week that saw another build in North American crude inventories and a continual unwinding of the seasonal bull unleaded trade, crude oil prices themselves continued to sage. The daily price chart had been calling for a downside move into the 96.35 area (bear flag pattern) and that has been hit. The next target was a move to the one year 50% retracement level (92.75) and now that has been hit. The next support zone appears to be in and around the two year 50% retracement level (89.445) and that shall be my downside target going forward. I would also point out that there is a candle gap that ought to be filled in and around the 86.80 level too. Having said all that, this market is very oversold and any justifiable excuse could lead to a dramatic one or two day rally. Be careful being short, that trade (in my opinion) is almost done.
Trading
Strategy (1 week): As was the case last week, while we are pointing lower I will still look for
lower prices to come. I expect the 90.89 level to be tested in earnest
as two current bear flag pole patterns have targets in that area. As suggested last week too, try to establish short positions on rallies rather than selling on stops to new lows. I am trying to incorporate Gartley type patterns into my trading to better fine tune entries (for more on harmonic trading please visit http://www.harmonictrader.com/)...
That's all for this post,
Brian Beamish FCSI
The Canadian Rational Investor
the_rational_investor@yahoo.com
http://www.therationalinvestor.ca
Brian Beamish FCSI
The Canadian Rational Investor
the_rational_investor@yahoo.com
http://www.therationalinvestor.ca


No comments:
Post a Comment