Price analysis you see is CLF13, for the week of December 7th, 2012. Each trading day a 15 minute chart is added and trades for that day are analyzed:
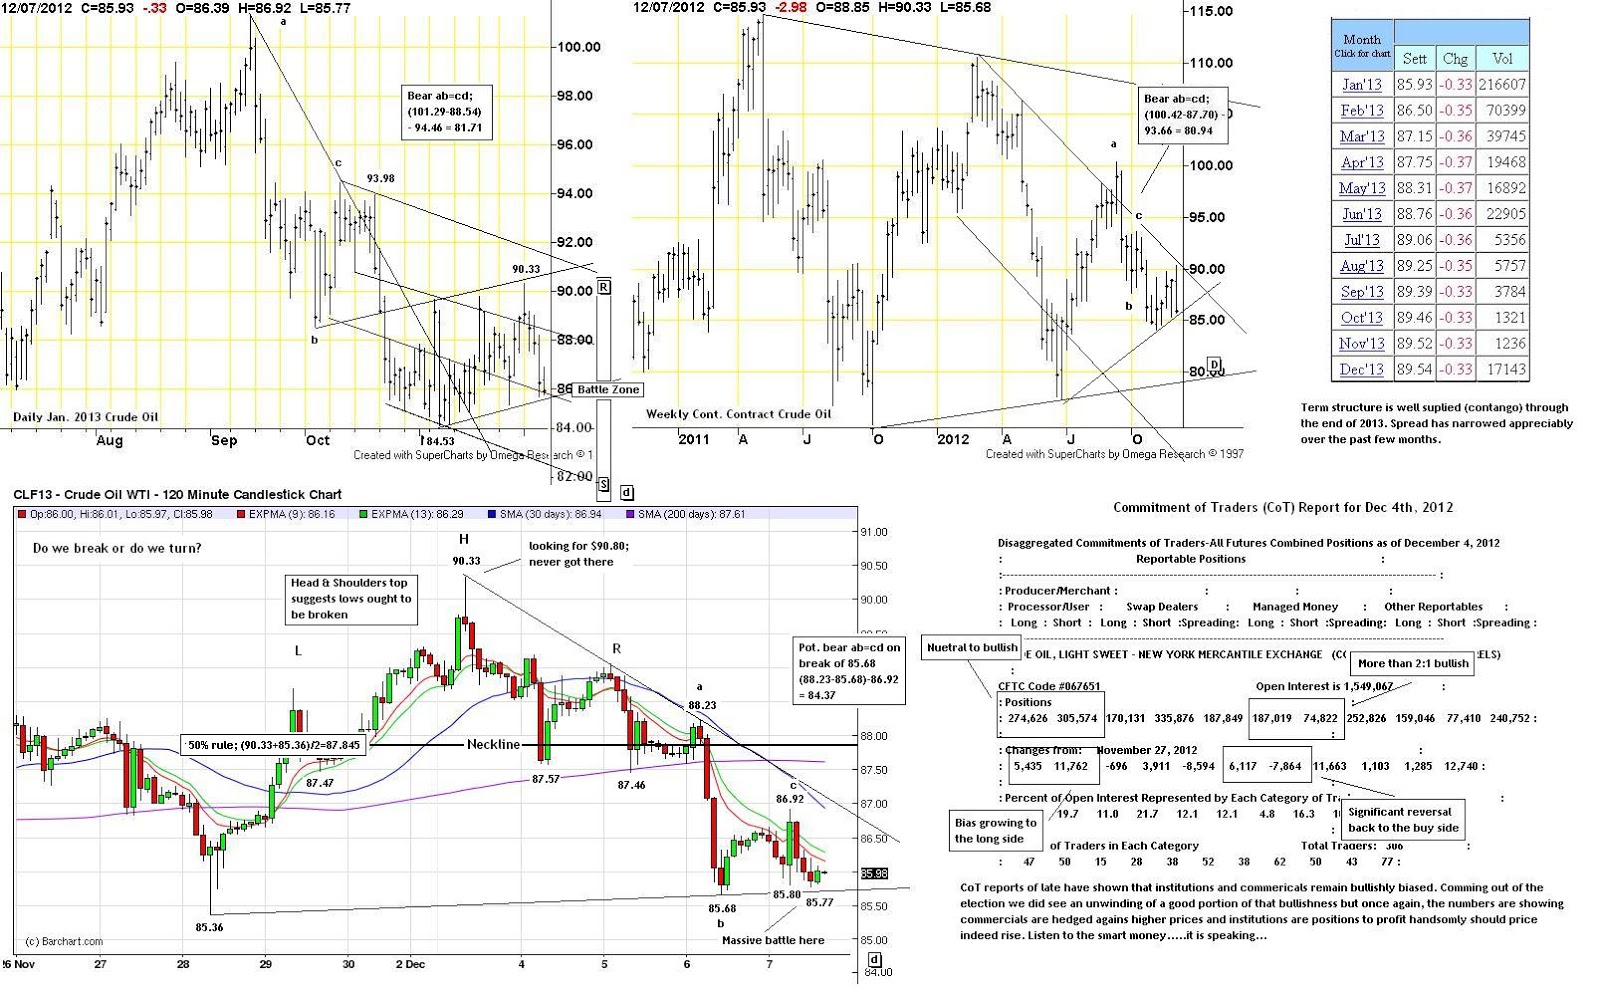
Weekly highlight: The bullish enthusiasm seem coming into the week was quickly dashed. Late Sunday evening and into early Monday morning prices reached for our $90.80 target, only to fall short (topping at $90.33). From there is was a consolidation into Wednesday's inventory number. That release showed a dramatic build in refined products and a preception of far weaker demand than what was previously though. Is this a temporary weather related disruption or something more perminant, only time will tell. Regardless, that bearish fundamental news broke tenuous support and suggested last week's lows ought to be tested in earnest. That test is currently underway and at the moment, It is too early to declare a victor. Should the bulls loose, daily and weekly bearish ab=cd targets point to the $84 area and then the low $80 area as our next significant areas of support.
Trading
Strategy (1 week): As outlined on the 2 hour chart, I shall start the week awaiting the resolution of the current battle. If the bottom is broken (and a subsequent failed test of the underside of these lows is established) I shall be looking into the low to mid $80's for price targets (as outlined on the charts above). Should these lows hold (with a momentum/volume bottom) I shall be looking for a test of the 2 hour 50% level followed by a rally into the entire range's OTE Short SS (70.5% retrace) which currently is at $88.95. Finally, should the rally be strong enough, I shall look for a test (and possible break) of last week's highs just above $90.33. I would be rather surprised if price can get much higher than those levels. Should that occur, a new review of the charts would be needed.
Mental
State Review: This past week was another small breakthrough for me on this long journey to becoming a successful day-trader. I had stated in last week's blog that my number 1 goal for the week was the take the NY Pit ORT every day (both legs if needed) and I did exactly that. Additionally, I really wanted to make the effort to post a 15m chart every day with both entries and exits as well as notes. I accomplished both goals and am both proud of myself for doing what I planned and a little shocked at the results. This was by far my most productive/profitable (relative to risk) trading week with TsT. As outlined on each day's chart, my entries and exits were well planned (followed trading plan to the letter) and I was rewarded with profits every day. I even commented in TsT's Lounge at the end of the week 'I think I have found my perfect little hotdog stand business'. Here then is last week's activity:

While no one should expect to be profitable every day, this is pretty much exactly how I would like to build a solid foundation for my trading business. Indeed, the ORT itself was only fully successful 3 of the 5 trading days but with a combination of the model and my 20 plus years trading experience I like how the trade feels. By forcing myself to take the NY Pit ORT, I am both active and focused at the start of every day. Additionally, the incremental income provides both a mental and financial cushion so that I can go stalk bigger trades through the rest of the day. If and when they come, I am in a far better position to do something. I am reminded of an old client's adage: 'always play from a position of strength, my boy'. Additionally, my rule of moving my stop to +20 ticks is a stop and not a market order. I do fully expect to one day in the not too distant future find that my stop doesn't get hit and I am carried along for a much bigger ride.
To that end, my goals for the coming week are to continue to trade every day's NY Pit ORT (both legs if needed) and be content should it be a bust (-$320). It is interesting to see in the above spreadsheet the column marked 'tinker risk'. It seems that my tinkering cost me about $400 through the trading week. I wouldn't have been nearly as accurate (as one day I would have been stopped out at a $150 loss vs the $65 gain I booked) but the AOCO sell orders would have been hit on three separate days (all over 20 ticks greater profit then where I got out). This has been a historical problem for me. Given my +20 tick rule I am not so upset since I am following a rule I wrote. I will work on being less hasty with my exits. The cushion I have built so far makes me far more comfortable with that notion going forward.
As well, I have a goal this week to mark on the 15m chart I post where I believe the 'trade of the day' occurred. I have found that about once per day the charts seem to line up with price/momentum/volume all pointing on one direction or another. Most times these days I seems to come in through the European session, but Friday for example I believe it came in about an hour or so before the US NFPR report. Once that rally was done, so was the day. Anyway, it should be an interesting experiment going forward.
That's all for this post,
Brian Beamish FCSI
The Canadian Rational Investor
the_rational_investor@yahoo.com
http://www.therationalinvestor.ca
http://crisdaytrading.blogspot.ca/
Breakout
Trade (BOT's: Price with Momentum & Volume)
Watch
and respect 30 minute, 1 hour, 4 hour & daily momentum &
always wait patiently for 15m momentum divergence/confirmation. If
15m momentum signal given then watch 5m for vol/mom signals. Use ema
checks (Holy Grail for example) at 5m trendline to enter positions
NOT Breakouts.
Range
Trade (OTE: Optimal Trade Entry based on test of resistance/support
levels)
Primary
tool for determining trade location is a 70.5% counter trend
retracement based on 1hr to 4hr chart price ranges.
Once
in zones, use momentum & volume divergence on 15m to signal trade
alignment.
Once
aligned calculate OTE entry & POTE (stop at least 11 ticks above
previous peak/trough). Enter order on an open order basis. AOCO
(-.21/+.41) at level. DO NOT alter – let run to fruition.
Extreme
Range Trade (ERT: Based on the Swing Pivot Touch theory)
Based
on the principle that initial tests of significant swing levels often
meet resistance. Look to identify key hourly swing points at or near
4 hour / Daily OTE levels. Follow same plan as OTE trades but enter
order to take position at key high/low not OTE or POTE level.
Opening
Range Trade (ORT: Based on pent up demand from overnight trade into
NYPit open)
Watch
5:55AM price bar highs and lows. Place open orders at 6:00.01 two
ticks above (buy on stop) and below (sell on stop) the 5:55 bar's
range (AOCO -.15/+.41). Once filled on one side cancel other order.
If trade reverses and stop is hit, look to take fail side of the
trade. (AOCO -.15/+.41). Maximum risk on trade is $310. Leave trade
on, trailing stops every 20 tick increments.
Monday's Trade (1-1 +$175):

1. I cost myself 23 ticks today in what I call tampering risk. The market did eventually go to my AOC +41 level before stopping the trade out.
2. The Trade of the day came on a counter trend rally (into a well define OTE level) at 86.54. That trade alone would have been good for 40 ticks if not a lot more.
A goal of mine this week is to try and identify the 'Trade of the day'. I believe the market sets up at least one healthy move per day, it is just a question of finding it. For the time being, I don't mind missing the trade, the important thing is to identify it and learn/memorize the setup. My hope is that If, in the future, I happen to see the same situation I can act more from memory than on blind faith.
Tuesday's Trade (0-0 $0):

Wednesday's Trade (1-1 +$405):

Thursday's Trade (5-5 +$45):

So for tomorrow - get up early, do your homework, follow the plan and don't tinker.....lets nip this thing in the bud!
Friday's Trade (1-1 +$205):

As an experiment, I have been trading the 7AM Range Trade (7RT) very much in the same way I trade the NYPit ORT. The cash market often gaps higher/lower then within the first half hour reverses that initial push and settles into a range. Just as the 5:55 (pst) 5 minute bar's action gives you specific marks to work with, the 7RT follows the same frame work. So with that said, my goal for the remaining 2 weeks of this trading year is to take the 7RT trade in addition to the NYPit ORT. I plan to make notations and references to it on my charts but will contain the 7RT to Practice account trading only until I am comfortable with it. So with all this in mind, we see from the chart above that the 7RT turned out to be one hell of a trade today. The initial signal was to go short (and I did so) when the 6:55, 5m bar's lows were broken. That short was stopped out at a 13 tick loss. The second leg of the 7RT came in right away and that long performed rather well. The 'buy' came in at 86.34 and the market didn't look back until my +41 tick AOCO sell order was filled. So for the record, 7RT was (2-2 for +$280).
No comments:
Post a Comment