Sunday, August 25, 2013

Update for the week of August 23rd, 2013

Welcome back to CRI's ongoing Crude Oil Day Trading Blog.

The first picture is the daily, weekly and 120 minute charts with Crude Oil's term structure and CoT summary for the week of August 16th, 2013. Each trading day (time permitting) a 15 minute chart is added and trades for that day are reviewed:


Market Overview: Late summer, 2013 is passing with little fan-fare. Stocks have cooled, bonds too, while the currency markets are relatively stable at the moment. Interestingly, over the course of the summer, only the Euro has established a floor to work with vs. the greenback, and that floor is tenuous at best. Considering the significant US political 'showdown dejour' coming in mid September, growth may come into question and a resumption of the 'fear' trade may not be off the table as of yet. Many assets are now no longer 'oversold' and one can really feel the low volatility summer atmosphere. Consider too September's historically poor performance and one has to give some serious thought to either hedging or even getting short.
 

Weekly highlight: As had been anticipated, prices bounced nicely off the 2 hour OTE long Sweet Spot (103.65) and rallied nicely for the remainder of the week. Indeed, we finished so strong one has to wonder if Crude prices are not finished moving higher just yet. In my daily 15m USO commentary I suggested upside targets off the bottoming action had been hit and even exceeded. Additionally, short term momentum studies looked a little suspect heading into the weekend. So my expectations is that we will need a bit of trading to clean up the momentum indicators and only after a day or two of consolidation should we get an idea of weather or not we move higher yet. Because of the significant holiday coming, my hunch is we drift up into resistance (and maybe even hit some of the projected upside targets previously posted) into the September 12th pivot and then being our seasonal correction in earnest.

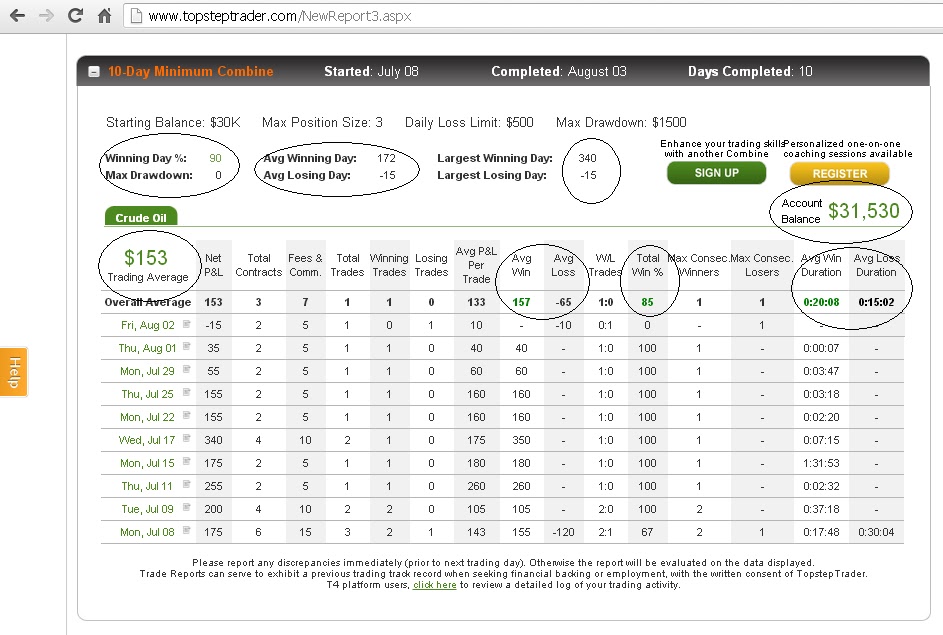
Personal journal: This past week I was able to reign myself in and get back on track. Because of the size of my account, risk must be less than 14 ticks per trade. And because of the specific setup I trade with TsT, initial rally/selloff moves (that being the point A to point B of the ab=cd price pattern) can not be more than 50 ticks. If that move is greater than 50 ticks then I must simply watch the whole pattern go by. Because of this realization, I found I was far less eager to take positions and was able to manage myself and my actions more appropriately over the course of the week. Irrespective of these limitations, the market did afford opportunities. Monday and Tuesday were tough as personal loss levels were hit (-25 ticks per day). Conversely, on Thursday I was able to book several winning trades and finish with a +90 tick day. The net balance was a marginally profitable week (roughly +30 ticks) and a renued confidence in both myself and the model - if followed appropriately. Indeed, the model does work, it's just a question of personal patients in letting me let the market tell me when to participate. Another week of paper trading like this and I feel I will be ready to switch back to 'real' trading.

Trading Plan: Continue to trade in the live/prac account as if it were real money. Do not even attempt a 'real' trade until at least three days of consistently taking 'valid' setups is established. I know for sure this entire week shall be 'practice' trading, the question for me right now is, can I get my discipline back for the post Labour Day market.


That's all for this post, 
Brian Beamish FCSI
The Canadian Rational Investor
the_rational_investor@yahoo.com
http://www.therationalinvestor.ca
http://crisdaytrading.blogspot.ca/

August, 2013 $30k 'live' trading plan:

Sunday, August 18, 2013

Update for the week of August 16th, 2013

Welcome back to CRI's ongoing Crude Oil Day Trading Blog.

The first picture is the daily, weekly and 120 minute charts with Crude Oil's term structure and CoT summary for the week of August 16th, 2013. Each trading day (time permitting) a 15 minute chart is added and trades for that day are reviewed:


Role period: Moved to October Crude Oil: CLV3
 

Market Overview: The currencies saw little volatility over the past week as the summer draws on. Interestingly, the metals seem to be taking this opportunity to 'correct' the massive sell-off through the spring. The 'ABG' trade that dominated for so long might be trying to re-establishing itself as all three components have gone through what I would consider rather healthy corrections. I for one shall be watching to see if they take over again. No real conclusions ought to be drawn through this seasonally suspect time of year so enjoy the short term price movements if you can and lets get ready for the fall.

Weekly highlight: Prices continued to steadily move higher over the course of the past week and even pushed briefly to new relative highs. Because of this, daily and weekly charts now have the old peak (109.32) within reach. Considering the significant instability within Eygpt and the volume late summer market, any rumor or serious story may send prices moving violently in either direction. The 2 hour OTE long sweet spot currently sits near 103 to 104 and would be a logical place to hunt for potential long setups through the coming sessions.


Personal journal: This past week I continued to take too many questionable trades. Until I can get my risk threshold/per trade constantly below 15 ticks I shall continue to paper trade. I lost money (prac/live) account this past week so obviously my 40 to 50 tick goal was not met. I shall continue to have that goal and try once again to get my discipline back. I have posted a few USO analysis charts and feel comfortable with those 15m long setups. I shall this week try to concentrate on only commenting on the market IF I see one of those setups come in, otherwise - do not even paper trade...

Trading Plan: Continue to trade in the live/prac account as if it were real money. Do not even attempt a 'real' trade until at least three days of consistently taking 'valid' setups is established. I know for sure this entire week shall be 'practice' trading, the question for me right now is, can I get my discipline back for the post Labour Day market.

Excellent example of the only trade setup I should be considering with the TsT account:


That's all for this post, 
Brian Beamish FCSI
The Canadian Rational Investor
the_rational_investor@yahoo.com
http://www.therationalinvestor.ca
http://crisdaytrading.blogspot.ca/

August, 2013 $30k 'live' trading plan:

Sunday, August 11, 2013

Update for the week of August 9th, 2013

Welcome back to CRI's ongoing Crude Oil Day Trading Blog.

The first picture is the daily, weekly and 120 minute charts with Crude Oil's term structure and CoT summary for the week of August 9th, 2013. Each trading day (time permitting) a 15 minute chart is added and trades for that day are reviewed:


Market Overview: While the US Dollar continues its recent consolidation, most of its major trading pairs moved basically sideways against the greenback over the past week. Within the commodity space, threats of a bumper 2013 US grain crop continue to weigh on that sector in particular and seeming to confirm this notion, meat prices have firmed considerably and are now starting to point higher in earnest. Elsewhere, metal markets appear to be firming as we move into a more bullish seasonal period for them. Specifically, our professor of economics, HG Copper, has a nice bottom working and suggests the world economy is on the mend.

Weekly highlight: As anticipated, prices slowly worked their way back down into support through the beginning of the week as benign terrorist threats and relatively little significant economic news kept people on the sidelines. A new threat to a European landmark (news link) and better Chinese economic data brought bidders back in (or at least covered their short positions) heading into the weekend. The significant low of 102.67 was tested and broken on the ultimate climax of the pullback. Failure for price to hold this low (and then its quick subsequent bullish reversal) has got the market's attention as both short term long setups and longer term short
setups emerged off that action.
 

Personal journal: The past week was an absolute roller coaster for me emotionally even though I didn't actually do any 'accountable' trades.
The good news: I did indeed receive news that I passed TopStepTrader's $30,000 combine and that they had enough confidence in me to go ahead and fund me as one of their junior live professional futures traders. I got to talk to (what I would consider a mentor) Senior TsT Scout John Hoagland for the first time in more than a year and the call itself actually represented a personal goal I wanted/needed to achieve. After the call, I had a good cry - I knew I could do, I just had to do it!
The bad news: When one reaches a significant milestone in life there is always the potential for 'slippage'. Like a correction against a trend in the market, one is foolish to expect anything to go in a straight line forever. And while there was no material damage done, I found the first three trades I took following my statues change with TsT (all in their Live/practive account) to be questionable at best, and down right foolish at worst. While they all had portions of 'correctness' within each of them, there wasn't overwhelming confluence and I myself was far too willing to take 'maybe' trades with far too much risk. The end result was a net loss of 27.5 ticks ($275) in one day's trading (Thursday). I was rather upset at myself through the rest of that day and gave the entire process some serious thought. Three conclusions jumped out at me and I have now added them to my trading plan. 
1. After any period away from the market (not on T4 and trading 'up-to-speed') I must take a similar period getting back 'up-to-speed'. Trade the same but only do it in practice account until you have put 2-3 days of exact model/plan following into practice (after reviewing with other traders, I found my 3 trades taken were not well timed - even slow). I now see that there is a 'speed' at which one must operate at to be effective. Taking the break (as outlined in last week's blog post) after finishing my last combine needs to be recognized and I need to understand that one can't just walk back on the field and expect to be running at optimal performance levels.
2. The model works - but only if I follow it to the letter. I must appreciate that because of the smaller account, there may be days where I simply don't take a trade. Others may be zipping in and out of the market (trading larger accounts and being able to take larger risks) but I must have the discipline not to trade.
3. Just because I am now a 'Live' funded trader doesn't mean any of this gets any easier. Indeed, I know what speed I need to operate at and the required degree of patients, vigilance and discipline needed. I have to bring all of that to the table every trading day.


Trading Plan: While TsT management puts together the funded account details, they have asked me to trade the 'live' practice account to the same level as I would trade a 'live' cash account. To that end, I will take the coming week and do exactly that. My goal should basically be the same as the combine and I have a weekly goal of taking 30 to 40 ticks from the market. My goal is to take 4 solid setups (30 to 40 ticks potential return with 10 to 15 ticks of risk) through this coming week. I will expect to have 2 trades work, 1 trade break even and 1 fail. This should result in a net profit of about 40 ticks.

That's all for this post, 
Brian Beamish FCSI
The Canadian Rational Investor
the_rational_investor@yahoo.com
http://www.therationalinvestor.ca
http://crisdaytrading.blogspot.ca/

August, 2013 $30k 'live' trading plan:

Sunday, August 4, 2013

Update for the week of August 2nd, 2013

Welcome back to CRI's ongoing Crude Oil Day Trading Blog.

The first picture is daily, weekly and 120 minute charts with Crude Oil's term structure and CoT summary for the week of August 2nd, 2013. Each trading day (time permitting) a 15 minute chart is added and trades for that day are reviewed:


Market Overview: Now that the 'dog days of summer' are here it should come as no surprise to see the currency market go relatively quiet. The latest NFPR number out of the US didn't impress and suggests the recent consolidation in the greenback may continue for a little while longer. Interestingly, the Aussie dollar pushed to new lows suggesting the commodity correction may not be quite done yet. Indeed, it would appear the threat of a historically robust US fall harvest has brought grain prices down and suggests further price depreciation within that sector over the near term.

Weekly highlight: Prices literally jumped out of the gate this past week and didn't really look back until we approached its end. Interestingly, price was NOT able to take out the 2 hour double top high (108.93) high, suggesting the move was more of a low liquidity 'stop run' rather then a genuine bull rally. Bulls would have loved to see price take out those highs and then consolidate - but alas, that was not meant to be. Considering the time of year, it wouldn't surprise me to see some more of these wild price swings through the later part of the summer. The 2 hour OTE long sweet spot (box highlighted on 2 hour chart above) looks like an interesting area to stalk for long positions but until that level is hit, I shall be watching for bear ab=cd patterns (to trade off of) while we work our way down to that target area.
 

Personal highlight: After more than 15 months working at it, I have for the first time successfully completed a TsT 'combine'. I met the stated profit objectives, remained within the very strict risk control thresholds and even met TsT's internal trade report scouting criteria. I am therefore now ready to take the next step in becoming a professional futures trader. I am so proud of myself for 'sticking to it' and not giving up - wtg Brian!
$30k Combine Objectives (10 day)
Profit Objective $1500
> 45% winning days
Avg. hold time of winners longer then avg. losers
Avg. winner > avg. loser
max daily risk $500
max draw down $1500

Screenshot of my combine:


I will openly admit, as I got within earshot of the objectives, I slowed my trading down and took the last 3 days very cautiously. As a result, my profit performance stalled. I believe that the model would have produced far greater profits over the combine period had I just let it take all the valid setups. 

I don't exactly know what the next step is in my journey, but feel very confident in both my trading plan and my personal abilities to be able to take this very marketable skill anywhere opportunity presents itself. It has been a very hard road to travel and I am basking in its fruition.

Trading Plan: I shall talk with Top Step Trader management about what our next steps ought to be and will probably take the coming week to watch more than trade.

That's all for this post, 
Brian Beamish FCSI
The Canadian Rational Investor
the_rational_investor@yahoo.com
http://www.therationalinvestor.ca
http://crisdaytrading.blogspot.ca/

July, 2013 $30k trading plan: