Sunday, September 30, 2012

CLX12 - Update for September 28th, 2012

Welcome back to CRI's ongoing Crude Oil Day Trading Blog. Price analysis you see is CLX12, for the week of September 28th, 2012:

Market Overview:  The much anticipated November US Presidential election and the very worrisome 'fiscal cliff' are quickly approaching and one can see the market setting itself up for the event. Interestingly, equity markets seem to be 'going parabolic' into the event while the US dollar is consolidating. Crude Oil itself recently pushed up to the psychologically important $100/barrel level only to back off just as quickly. Given energy's significant role within the electoral process, one has to wonder if a little 'tinkering' has gone on of late by those in power to remain in power. Regardless, the summer seasonally long trade in the energies has come and gone; now it appears it's time to do some back-filling...

Weekly highlight: This past week saw a bit of a consolidation and then another push lower. The latest push confirmed a rather nasty daily bear ab=cd pattern suggesting that the bears are firmly in control for the time being.
Trading Strategy (1 month): This past week saw further price consolidation with a now confirmed (and very steap) bearish ab=cd price pattern working. As long as 93.84 is not taken out, I shall be looking for prices to continue to slip until the bear ab=cd target of 84.07 has been hit.


Mental State Review: I was and continue to be frustrated at inability to get into a position at 1hr/4hr turning points and hold on. I am currently a good 'scratch' trader (meaning I manage risk well and am consistently marginally profitable). The question is, how do I take the next step? I am determined and focused, it is just a question of getting the process down and continually repeating the same thing. I often find I drift and this gets me into danger. Less drifty....more focusy

Trading Plan for this coming week: Watching for and using 'OTE' setups to identify buying and selling opportunities at key support/resistance levels on the 60m/4hour charts. Once trade zones are entered, drill down to 5m/15m for OTE entry points and follow the trade process.
Picture everyday my ideal trade....looking for momentum divergences at or near OTE zones on 1hr/4hr charts; tight reversal, clean additional OTE entry signals on shorter time frames where tgt is +.42 and stop is -.21.... 

Trade Process: b/s 1 aoco (-.21/+.41) at 5m OTE entry levels where prev. peak (+/-.10) is no greater than 21 ticks....three wrong trades in a row = -$645.00 and end of day
Focus for the week: lets get back to the plan, it works but it takes discipline...

That's all for this post,
Brian Beamish FCSI
The Canadian Rational Investor
the_rational_investor@yahoo.com
http://www.therationalinvestor.ca
http://crisdaytrading.blogspot.ca/

Sunday, September 23, 2012

CLX12 - Update for September 21st, 2012

Price analysis for the week of September 21st, 2012:
Roll has begun and we are now in November Crude (CLX12)


Writer's note: While I sincerely hope that some, if not all of the information I post on this blog is helpful to you in your trading experience, the reader should be aware that I do this blog as much for myself as I do it for the public. This is a learning experience and I am going to make a lot of mistakes along the way....
Market Overview:  The much anticipated November US Presidential election is quickly approaching and one can see the market setting itself up for the event. Interestingly, equity markets seem to be 'going parabolic' into the event while the US dollar is consolidating. Crude Oil itself recently pushed up to the psychologically important $100/barrel level only to back off just as quickly. Given energy's significant role within the electoral process, one has to wonder if a little 'tinkering' has gone on of late by those in power to remain in power. Regardless, the summer seasonally long trade in the energies has come and gone; now it appears it's time to do some back-filling...

Weekly highlight: This past week was dominated by sellers as price failed to hold onto $100/barrel to begin  the week and ultimately ended near $93.00. The exhausted move up through $100 was a trap. As a result of the breakdown through the previous key lows ($94.28) bullish ab=cd targets have been negated.
Trading Strategy (1 month): The fact that the market tried to push through $100/barrel then failed and broke back below the recent significant lows suggests the bull has run out of steam. Considering the proximity of the daily 50% level I won't be looking for too much further on the downside before a serious test of the $95.00 to $100.00 area ought to come. In short, I shall be looking for a test of the 60m 50% level ($95.84) before looking for a further move to the daily 50% level ($89.73).

Mental State Review: This past week was very tough for me as I couldn't wrap my head around the dramatic mid week price fall. I have a general rule to stop trading when a market goes 'fast' and indeed, practice account trades around that event turned out to be consistent loosers (to the tune of several thousand dollars!). Because of minimum trading day requirements by TsT (more on them here) I forced myself to attempt to trade my 'combine' account on Friday (which in itself couldn't have been a worse time for me to trade as it was a triple witching day) and it lead to more dramatic losses (-$450). I was very upset at myself and how I approached the market in general. I am concerned about my recent over-trading in the practice account (and the laissez-faire attitude it built in me about Sim losses). This definitely spilled over into my combine trading and thank heavens I stopped the run away train before it did too much damage. What I find interesting is that when I asked the resident psychologist for his suggestions (Dr. M.) about how to get back on track with my trading plan, his response was to come up with a new trading plan....I'm not quite sure what to make of that advise but have taken it under considerations.
I am going to be working with a new trading strategy based off the 5m chart (as some have suggested I ought to spend more time concentrating on that as apposed to larger time frames to be a successful 'day-trader'). While I am still working out the kinks I shall remain mute on it. Given my peer's feedback regarding my recent failings (of which I asked for their opinions) the one thing that remains clear to me is that this is still a work in progress....
Trading Plan for this coming week: Given the current volatility, I shall be reluctant to get too aggressive until a new trading range has been established. Having said that, I shall be watching for and using 'OTE' setups to identify buying and selling opportunities at key support/resistance levels on the 60m/4hour charts. Once trade zones are entered, drill down to 5m/1m for OTE entry points (and new 5m reversal bar entry signals) and follow the trade process.
Picture everyday my ideal trade....looking for momentum divergences at or near OTE/HG zones on 1hr/4hr charts; tight reversal, clean OTE entry where tgt is +.42 and stop is -.21.... 

Trade Process: b/s 1 aoco (-.21/+.41) at 5m OTE entry levels where prev. peak (+/-.10) is no greater than 21 ticks....
Focus for the week: lets get back to the plan, it works but it takes discipline...

That's all for this post,
Brian Beamish FCSI
The Canadian Rational Investor
the_rational_investor@yahoo.com
http://www.therationalinvestor.ca
http://crisdaytrading.blogspot.ca/

Sunday, September 16, 2012

CLV12 - Update for September 14th, 2012

Price analysis for the week of September 14th, 2012:


Market Overview:  QE3 has hit the US dollar index with vengeance. As a result, most commodity prices appreciated over the past sessions with Crude Oil being no exception. As we approach the highly anticipated November US Presidential elections it appears a bit of a 'blow-off' top seems to be building. One can only ponder at what lays ahead of us once on the other side of that event. Should the political landscape be little changed come the end of November, the 'fiscal cliff' will be fast approaching and what may appear as prudent austerity may lead us all into outright depression. it is little wonder to this market prognosticator that the US Fed is trying to front load the economy in anticipation of such an event...
Weekly highlight: This past week saw a breakout through the high end of our recent trading range (97.70 area) and a subsequent move up above the psychologically significant BFRN (big fat round number) of $100.00. Considering the key weekly low of $100.68 was not breached and we settled the week back below $100.00, a test of the recent trading range breakout area (again the 97.70 area) ought to be tested over the short term.

Trading Strategy (1 month): As has been the case for a few months now, the daily chart continues to point higher so my bias remains to the upside. As well as the existing bull ab=cd target of $102.50, the breakout through 98.29 suggests we have another bullish ab=cd target of $105.04 to work with going forward. Consider too the pending US elections in early November and it is tough for me to make the argument for a serious correction over the coming few weeks. Pullbacks in my opinion are still buying opportunities.

Trading Plan for this coming week: This past week I felt more comfortable with the process. Use 'OTE' setup to identify buying and selling opportunities at key support/resistance levels on the 60m/4hour charts. Once trade zones are entered, drill down to 5m/1m for OTE entry points and follow the process.
Picture everyday my ideal trade....looking for complete washout at or near OTE/HG zones on 1hr/4hr charts. 
b1 aoco (-.21/+.41)....If system is 70% accurate. in 10 trades net ret. = 2835 - 645 = +2190.00
Focus for the week: Stick to the trading plan.....do your research, pick your marks to watch for and act accordingly at those marks...stick to the plan.

That's all for this post,
Brian Beamish FCSI
The Canadian Rational Investor
the_rational_investor@yahoo.com
http://www.therationalinvestor.ca
http://crisdaytrading.blogspot.ca/

Sunday, September 9, 2012

CLV12 - Update for September 7th, 2012

Price analysis for the week of September 7th, 2012:


Market Overview:The little ones are back at school, vacation cottages are closed up and the regular work routine is in the process of re-establishing itself. This transitional process can (and often is) met with some extreme volatility as many different market participants come together all at once. Indeed, this past week saw at least two gut wrenching stop runs only to quickly reverse and move just as violently in the opposite direction. For those nimble enough to take advantage - congrats, I am still in the process of building out my process and unfortunately (like many others) got sucked up into the 'stop running' machine. Looking back over the past week's chart, I am not as sanquine as I was on Friday afternoon as I realise now many other people must have gotten beaten up too in this directionless volatility. 


Weekly highlight: One I would rather forget. While losses themselves were not large, profits were little and personal frustrations showed through the end of the trading week. It is easy to get upset if one trades for a living and we go through periods that just don't make sense. Until we resolve this current trading range ($93 to $98) I think it best to trade one lots and be very conservative....bottom picking can be very costly.

Trading Strategy (1 month): The daily chart continues to point higher and there are still some valid upside targets yet to be hit. So with that said, last post's comments seem to still hold true, I am leaning towards higher, not lower prices. New upside objectives include a small daily bull ab=cd (target of 99.74) as well as a gap that ought to be filled at 99.53. Lastly, we do have a rather noticeable weekly bullish ab=cd currently working which in itself suggests prices want to eventually move towards the 102.50 area (which happens to correspond with the same level as the massive daily bull ab=cd, 102.54).

Trading Plan for this coming week: I am rather disappointed in myself in that I strayed from the trading plan over this past week and trading performance suffered. So like my previous post, my trading plan for the coming week should be as follows: Use 'OTE' setup to identify buying and selling opportunities at key support/resistance levels on the 60m chart outlined above.
Picture everyday my ideal trade....looking for complete washout at or near OTE/HG zones on 1hr/4hr charts. 
b1 aoco (-.21/+.41)....If system is 70% accurate. in 10 trades net ret. = 2835 - 645 = +2190.00
Focus for the week: Stick to the trading plan.....do your research, pick your marks to watch for and act accordingly at those marks...stick to the plan.

That's all for this post,
Brian Beamish FCSI
The Canadian Rational Investor
the_rational_investor@yahoo.com
http://www.therationalinvestor.ca
http://crisdaytrading.blogspot.ca/

Sunday, August 26, 2012

CLV12 - Update for August 24th, 2012

Price analysis for the week of August 24th, 2012:

Market Overview: Prices felt like they were nearing exhaustion into the end of this past week. The market did get a boost from very dovish comments from the US Federal Reserve (through the release of the Fed Meeting Minutes). As a result, the US dollar lost a good deal of 'rate' premium and even went as far as to price in a resumption of the very controversial 'quantitative easing' program. Should a QE3 begin in earnest, one ought to expect a dramatic escalation in prices very similarly to our last two rounds. Indeed, gold and silver both seem to be pricing in a reversal of previously dis-inflationary policy and a resumption of US dollar devaluation. Not only have prices based but we may actually be setting up for a substantial move higher. Oh, did I mention, the S&P 500 is at a new 52 week high...

Weekly highlight: The previously mentioned large purchases by Institutions coupled with the renewed talk of QE3 and indeed the market moved higher. Comments from last week's post continue to seem pertinent: Additionally, the rather noticeable breakdown in the US long treasury market suggest that higher, not lower asset prices ought to be expected for at least the next little while. Good corporate earnings, good economic numbers and a friendly US Federal Reserve Board have all laid the groundwork for a significant test of the spring stock market highs and in my opinion a substantial move higher over the coming weeks/months

Trading Strategy (1 month): As we head towards Labor Day and even into the first week or so beyond, I am leaning towards higher, not lower prices. New upside objectives include a small daily bull ab=cd (target of 99.74) as well as a gap that ought to be filled at 99.53. Lastly, we do have a rather noticeable weekly bullish ab=cd currently working which in itself suggests prices want to eventually move towards the 102.50 area (which happens to correspond with the same level as the massive daily bull ab=cd, 102.54).

Trading Plan for this coming week: As stated above, I shall be looking for this move to continue to the upside but do expect quick violent moves lower to try and flush out as many 'weak hands' as possible. Continue to use 'OTE' setup to identify buying and selling opportunities at key support/resistance levels on the 60m chart outlined above.
Picture everyday my ideal trade....looking for complete washout at or near OTE/HG zones on 1hr/4hr charts. 
b2 aoco (-.24/+.10/+.41)....on fill leave stop on remaining at original level! Risk becomes $130. Reward if target hit = $500.00. If system is 70% accurate. in 10 trades net ret. = 3500 - 1500 = +2000.00
Focus for the week: I feel more comfortable in the trading seat than I have before and I believe that is a direct function of closely examining my feelings behind trading (as outlined in prev. homework from TsT's Dr. M.). This past week's homework was and is to pick one or two process goals and work very hard on both achieving the goal but also in creating some sort of feedback loop to assess and reassess progress. Picturing myself executing my ideal trade every morning and each time I take a 'market state' reading shall be my process goal for the coming weeks. It shall be interesting to see if it cuts down on a lot of the little nonsense trades one gets oneself into out of boredom...

That's all for this post,
Brian Beamish FCSI
The Canadian Rational Investor
the_rational_investor@yahoo.com
http://www.therationalinvestor.ca
http://crisdaytrading.blogspot.ca/

Saturday, August 18, 2012

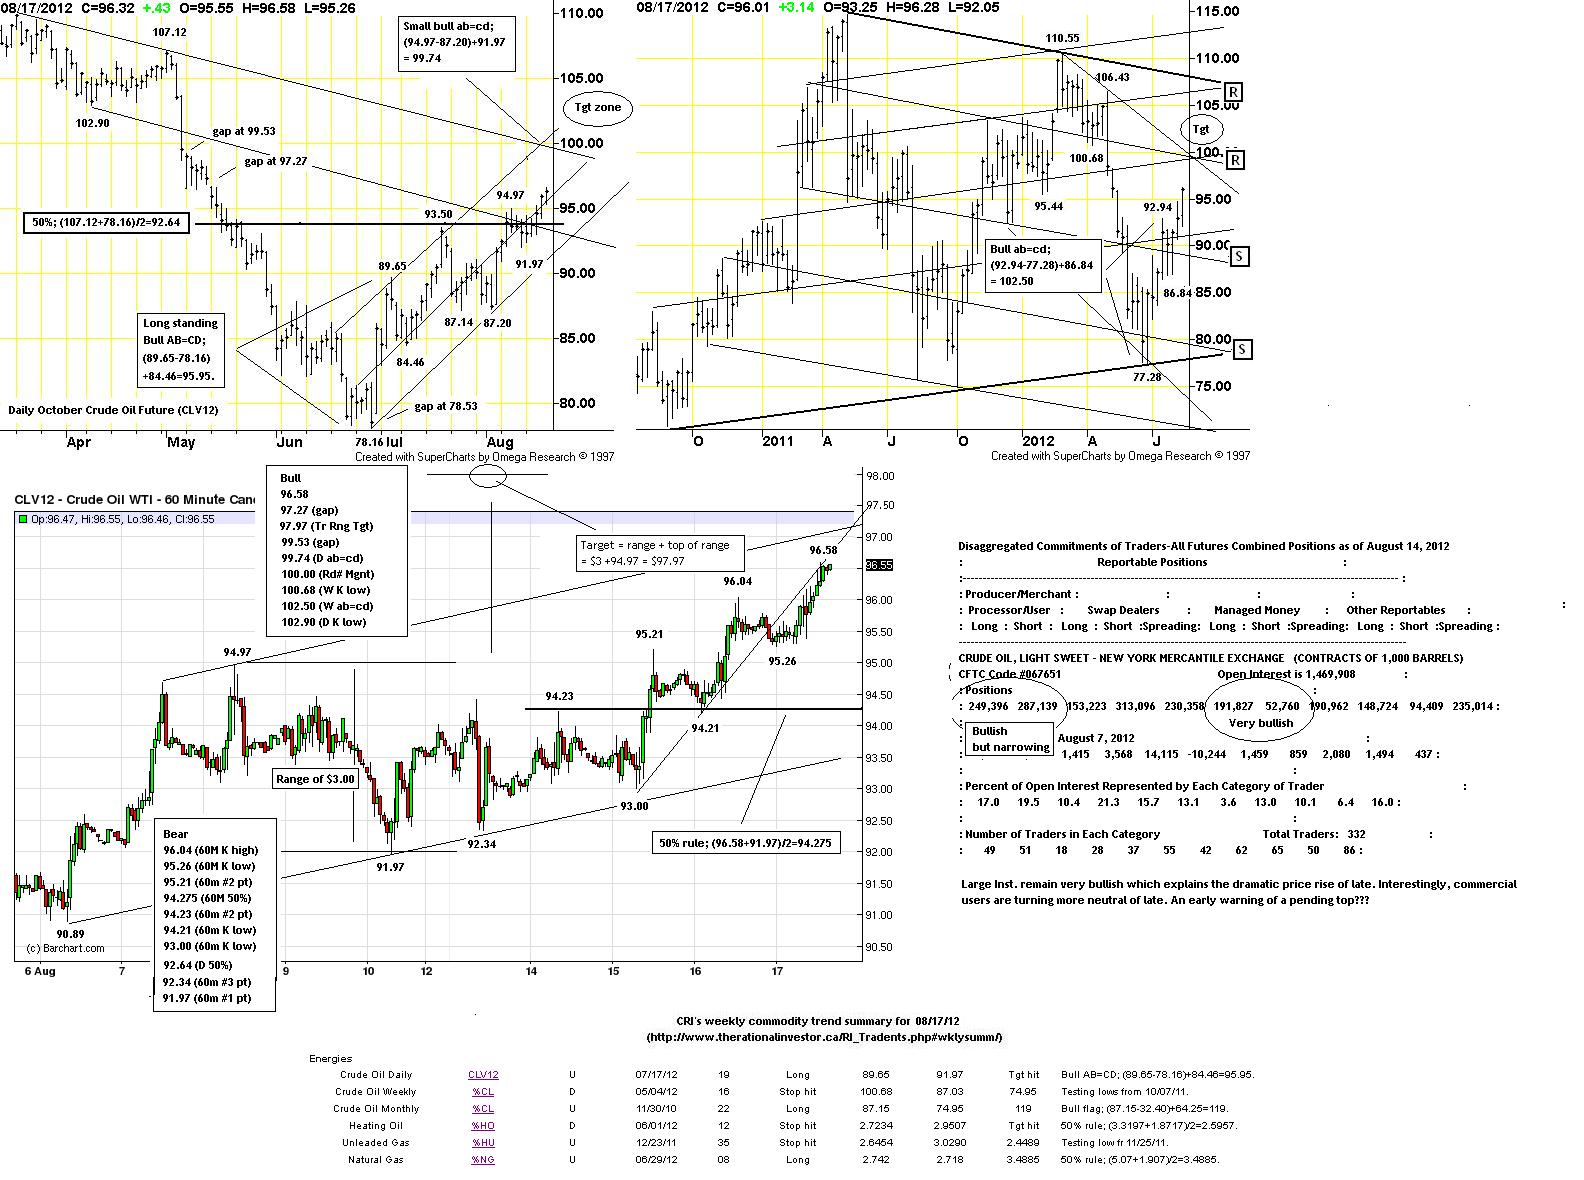
CLV12 - Update for August 17th, 2012

Roll has begun and we are now in October Crude (CLV12) 

Price analysis for the week of August 17th, 2012:
 
Market Overview: As the end of the summer approaches so too does Labor Day weekend. This event is often coupled with extremely low volumes with violent price action. Since September is often a poor month for asset performance, a good portion of the rally we are witnessing now (and over the coming three weeks) may be given back rather quickly once the professionals come back from their vacations.

Weekly highlight: The previously mentioned large purchases by Institutions did indeed set up the market to move higher. Additionally, the rather noticeable breakdown in the US long treasury market suggest that higher, not lower asset prices ought to be expected for at least the next little while. Good corporate earnings, good economic numbers and a friendly US Federal Reserve Board have all laid the groundwork for a significant test of the spring stock market highs and in my opinion a substantial move higher over the coming weeks/months. 

Trading Strategy (1 month): The previously stated upside objective (daily bull ab=cd) has been hit and exceeded. With this target hit one ought to expect a bit of a correction but given the light volumes and seasonality, that correction ought to still be considered a buying opportunity. New Upside objectives include a small daily bull ab=cd (target of 99.74) as well as two significant gaps that ought to be filled (97.27 & 99.53). Lastly, we do have a rather noticable weekly bullish ab=cd currently working which in iteself suggests prices want to eventually move towards the 102.50 area.

Trading Plan for this coming week: As stated above, I shall be looking for this move to continue to the upside but do expect quick violent moves lower to try and flush out as many 'weak hands' as possible. Continue to use 'OTE' setup to identify buying and selling opportunities at key support/resistance levels on the 60m chart outlined above.
Focus for the week: I am comfortable with 'OTE' trading and I want to focus this week on Trade Process goals. Additionally, a TsT adviors (Dr. Menikar) has given recruits an assignment to really explore feelings around loosing trades. How does it make me feel, what are those feelings, are they justifiable and is acting on those feelings really in my best interest.....very interesting stuff....

That's all for this post,
Brian Beamish FCSI
The Canadian Rational Investor
the_rational_investor@yahoo.com
http://www.therationalinvestor.ca
http://crisdaytrading.blogspot.ca/

Sunday, August 12, 2012

CLU12 - Update for August 10th, 2012

Price analysis for the week of August 10th, 2012:


Market Overview: Crude Oil prices are slowly retracing a good portion of the late spring/ early summer sell-off. One ought to have expected some sort of bounce (where multiple 50% rules were pointing towards the $92 to $93 area). That 'easy money' rally is now behind us and one ought to be a little more conservative (with regard to upside or downside price projections) at least until we are out of the 'dog days' of August. Indeed, we are now quite comfortably into what are known as 'the summer doldrums' where volume thins out as many market participants are on vacation. Within these types of environments price action can be swift and violent yet lack conviction - be careful. 

Weekly highlight: Most notable of late, institutions were back loading up on the long side of the market (this past week's CoT report showed a net swing of 30,000 contracts to the 'buy' side by large institutions). Is the smart money looking for further price appreciation in the short term? Was this past week's 'distributive' price action nothing more than the institutions passing on some of their recent purchases to retail customers? Only time will tell, but as the saying goes - volumes speak volumes...

Trading Strategy (1 month): (same as last week) the rather significant double bottom that was registered on the break of 90.95 shall act as support in the short term. My upside target remains the daily ab=cd bull pattern goal of 95.68. I am concerned this latest move higher has NOT been confirmed by momentum studies. This suggests we do have a bearish momentum divergence building on a daily basis. While not confirmed yet, it does suggest the bull isn't as strong internally as price would suggest. It also implies a push into our target zone (95.68) ought to be considered the end of the run (profit opportunity) and not the beginning of a new bull leg (no new buying until this momentum divergence is resolved). Since this is building on a daily basis it should be interesting to see how this plays out for day trading purposes.
Trading Plan for this coming week: The consolidation I was looking for took almost the entire week to play out with prices pushing to new highs early and failing late. In what technician's refer to as a 'Head & Shoulder's' top, price looks like it wants to probe down into the 91.12 area once again. Additionally, a 50% retracement of the entire move up (90.82)
ought to lend support to prices testing the previously mentioned important area (90.95) in the short term. We did trade to 91.71 and put in a 60 minute double bottom through the end of Friday's session by closing above 93.28. This complicates things because it suggests there is a lot of support at the daily, weekly 1 year and weekly 2 year 50% levels and this really isn't an area you should be trying to squeeze nickles and dimes out of. Considering too the bullish tone to the overall market (seasonally an OK time for stocks so PoLR = up) and our yet-to-be-hit daily bull ab=cd target (95.68) and there are plenty of reasons for me to be bullish. Bull / Bear marks to watch outlined on chart above (it is interesting to see I have nothing between $94.74 to $95.68 and $89.63 to $87.58).
Focus for the week: Adding 'OTE' to analysis process has both increased trading opportunities and overall market confidence. Risk/reward models are far better, trade duration models are better and frankly I have been stunned by the amount of money that has been made through 'OTE' signals of late - stunned (and I have been at this game a long time). There have been draw backs to adding to the Analysis process in that my Trade process has suffered and that shall be my focus for the coming week. I have had a couple weeks to get used to OTE's and now have to work on my 'algorithmic' approach to the Trade process. I have a sneaky suspicion that (very much like the HG trade setup) a maximum of $500 risk (or 50 ticks) is just too little a 'risk window' to trade either HG's or OTE's effectively. I will continue to keep data on trade success/failure and how much farther the market went before it did indeed turn.

Analysis process: 
Step 1. Initial Position: Assuming the 60m chart is both trending (as measured by 9/20ema relationship) and has well established targets (typically I use 'harmonic' price patterns like the ab=cd for example) and both volume and momentum are in confirmation. On 15m signal (9/20ema confirmation of trend, price trading at or between 9ema & 20ema with momentum & volume confirmation) move to Trade Process. Ideally I would love to see these signals come in right at 'OTE' entry points.
Trade Process: Upon completion of analysis process begin trade process. 
Step 1. Enter order (on stop) to take a position on 1 (one) contract AOCO -12 [for total risk of $125 on the trade] / +40 [for total reward of $400 on the trade]. AOCO means that once the primary open order is filled there will be an automatic exit order entered on 1 (one contract) at plus 40 ticks ($400). Additionally, there will be a stop loss order entered on 1 (one contracts) at minus 12 ticks ($120). Once the exit order is filled (at plus 40 ticks) the stop/loss order is cancelled. I am scaling back to one contract on the initial trade entry because I have found it is far more efficient to add to the position, once it has become evident the market has indeed found support/resistance and is turning rather than go 'all in' on the initial test of target. Trade process step 1 may take 2-3 attempts. Should stops be hit, it is important to identify 78.6% and 88.6% and repeat. Because of current risk model ($500 maximum risk or 50 ticks per day) my day's activity will end on three consecutive failed attempts. This is highly unlikely but a very realistic probability (10%???) so winning trades must be maintained and maximized....because if this I am reluctant to implement the b/e+.01 strategy at this time. 
Analysis process:
Step 2.
Adding to the trade: (Referring now to the 5 minute, 1 minute and (120)Tick charts). Once a turn has become evident, use momentum, price and volume signals (all time frames must agree) to add to position.
Trade Process:
Step 2. Enter order (on stop) to take a position on 1 (one) contract AOCO (risk should be determined by support &/or resistance and higher or equal with position 1's stop.....no more than maximum risk of 12 ticks or $125)/+.40. Once price, momentum & volume turns are in we should be fully invested in either 'OTE' or 'HG' trade. Long 2 contracts with 2 stop orders working (maximum risk $250) and 2 sell orders working (maximum reward $790). 
Question: At what point do I either let one of the contracts just run (ie. remove AOCO sell at +.40 on one contract) or change the stop orders to 'Trailing stops'. Something I will need to work on through the coming week.
Interestingly, once the orders are placed and filled by Trade Step 2. the work is basically done.....its now just a question of if my analysis is indeed 70-80% correct.

Question you have to ask yourself every morning: 'Are you in the game?' It is OK not answer no; but if you answer yes - then its 110% focus or you are just wasting time....

That's all for this post,
Brian Beamish FCSI
The Canadian Rational Investor
the_rational_investor@yahoo.com
http://www.therationalinvestor.ca
http://crisdaytrading.blogspot.ca/