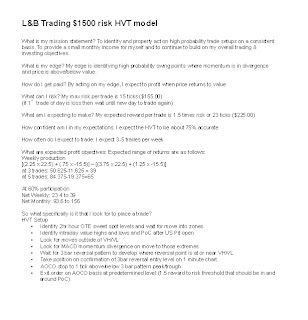
For this week's post I thought I would do something a little different. I have broken this past week down by HVT setups. Each image is a 2hr, 15m and 1m with Fib's, MA's and notes. Each image should demonstrate 1. into or exceded OTE L/Sh ss, momentum divergence then 1 minute 3bar reversal pattern for entry. These charts do not include Volume Profile data but needless to say, all of these trade locations were either above or below 70% value lines. All of the setups performed well and hit their respective 1.5 x risk profit objectives. Indeed, the signals were so good, they often translated into substantial gains with little to no downside risk.
I am therefore going to concentrate my efforts in hunting these rather unique opportunities and will only consider trades for the coming week that meet the basic HVT model.
10/07/13
HVT Long
HVT Short
10/08/13
HVT Short
10/09/13
HVT Long
10/10/13
HVT Long
10/11/13
HVT long setup came in but was more than 30 ticks risk so did not give trade consideration
Needless to say, it was both a busy and profitable week for HVT traders. Especially for those who could run multiple cars and on the exit of the 1st car, move stops on remaining 'freebies' to breakeven and then let the market go were it may...and oh boy, did it go in a couple cases....
These setups are my bread and butter and I will be hunting for them through the entire week. I shall try and post a 3pic summary (like above) when I see one pop up.
Cheers
That's all for this post,
Brian Beamish FCSI
The Canadian Rational Investor
the_rational_investor@yahoo.com
http://www.therationalinvestor.ca
http://crisdaytrading.blogspot.ca/
Brian Beamish FCSI
The Canadian Rational Investor
the_rational_investor@yahoo.com
http://www.therationalinvestor.ca
http://crisdaytrading.blogspot.ca/


No comments:
Post a Comment