Roll week - December Crude CLZ3
The first picture is the daily, weekly and 120 minute charts with Crude Oil's term structure and CoT summary for the week of Oct. 18th, 2013. Each trading day (time permitting) a 15 minute chart is added and trades for that day are reviewed:

Market Overview: The end to the current US Fed. government budget battle (and its associated debt ceiling issues) has come and gone. While many were worried, it does seem to me the current market action is nothing more than business as usual. The US dollar is looking rather 'toppy' here in itself and I am sitting here wondering if the 'risk-off' trade is slowly unwinding. Bonds look happier, stocks are still pointing up and economic barometers like Copper actually don't look too bad. Indeed, this year, like so many in the past, may see the snow come and with it some great buying opportunities. On a final note, through all of the mess in Washington, Sugar prices have moved considerably higher. OnlyDoubles trade blog subscribers have been given a really nice treat for less then a months work - who says there are no bull markets...
Weekly highlight: This past week saw price remain within a wide downwardly pointing channel inwhich successively lower lows and lower highs took us down. Considering the mounting technically bearish evidence (the daily chart alone has three significant downside price objectives working at the moment) one shouldn't be too surprised to see us trade to the bottom of the current 2 hour channel over the coming week or two. Indeed, October often comes with some surprises so I for one am in no hurry to make any serious commitments to the long side until we are comfortably into November.
Personal journal: Aside from one really bad mess-up, I have been doing really well of late. I have been disciplined and was making small amounts of money. Now for the mess-up. I had one bad day, Thursday, in which I hit my PLL and exceeded it (-43.5 ticks). I did three trades over the period of 8 minutes and basically broke all my trading plan rules. While I was in the trades I completely lost touch with my regiment and ignored lots of 'mixed' signs that in themselves would have prevented me from doing anything. I honestly felt possessed and only 'came to' when I was looking at a $435 loss and my entire positive balance erased.....remarkable. I shut down immediately after the third loss and spent the rest of the day very depressed. I did spend Friday chatting with peers and journaling. It was tough but it was also good to really analyze what happened. I need to plan the 'what happens if I am stopped' better. and I think I need to work on that 'rule' for a bit over the coming sessions...
Trading Plan: HVT setups where price has entered an OTE zone, momentum is currently in diveregence on 15m/3m, price is above or below daily Volprofile VH/VL and re-entering it and 3 bar 1m price reversal pattern as entry. All orders entered on an AOCO basis on the completion of 1m 3bar pattern at entry level. AOCO Stop at no more than -14, exit must be at least 1.5 times risk or +21 ticks. Order should rest near 38.2% retracement of prior move, PoC, Recent H/L. MUST SHUT DOWN on 2 initial losses or breach of 50% highwater mark on the day.
That's all for this post,
Brian Beamish FCSI
The Canadian Rational Investor
the_rational_investor@yahoo.com
http://www.therationalinvestor.ca
http://crisdaytrading.blogspot.ca/
Brian Beamish FCSI
The Canadian Rational Investor
the_rational_investor@yahoo.com
http://www.therationalinvestor.ca
http://crisdaytrading.blogspot.ca/
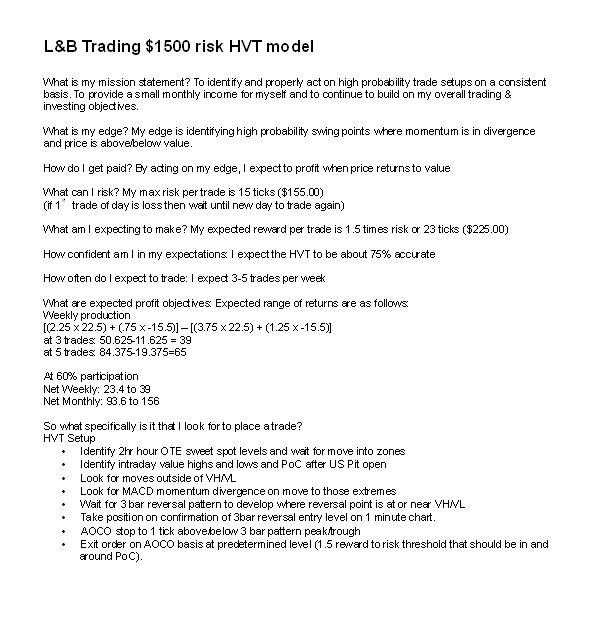
Screenshot of current L&B trading plan:
No comments:
Post a Comment